0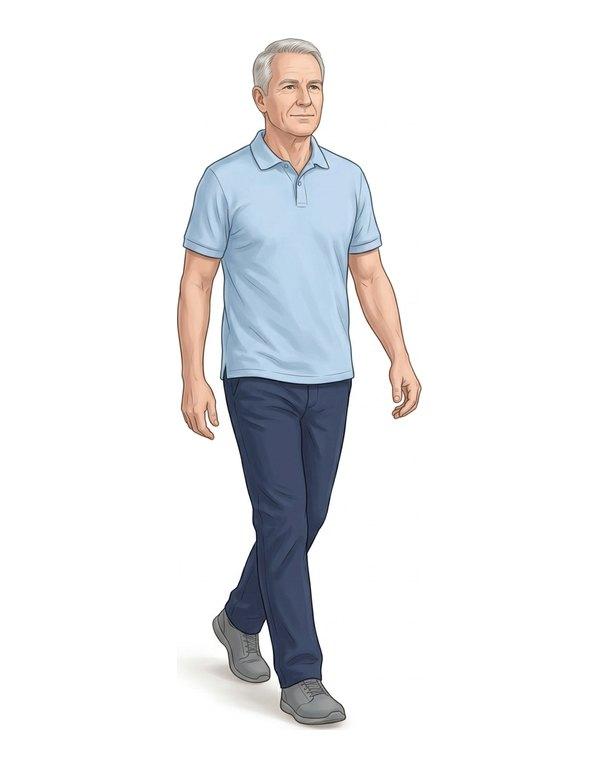
mRS 0: No symptoms
No symptoms at all from the stroke. Life is the same as before.
Free Tools
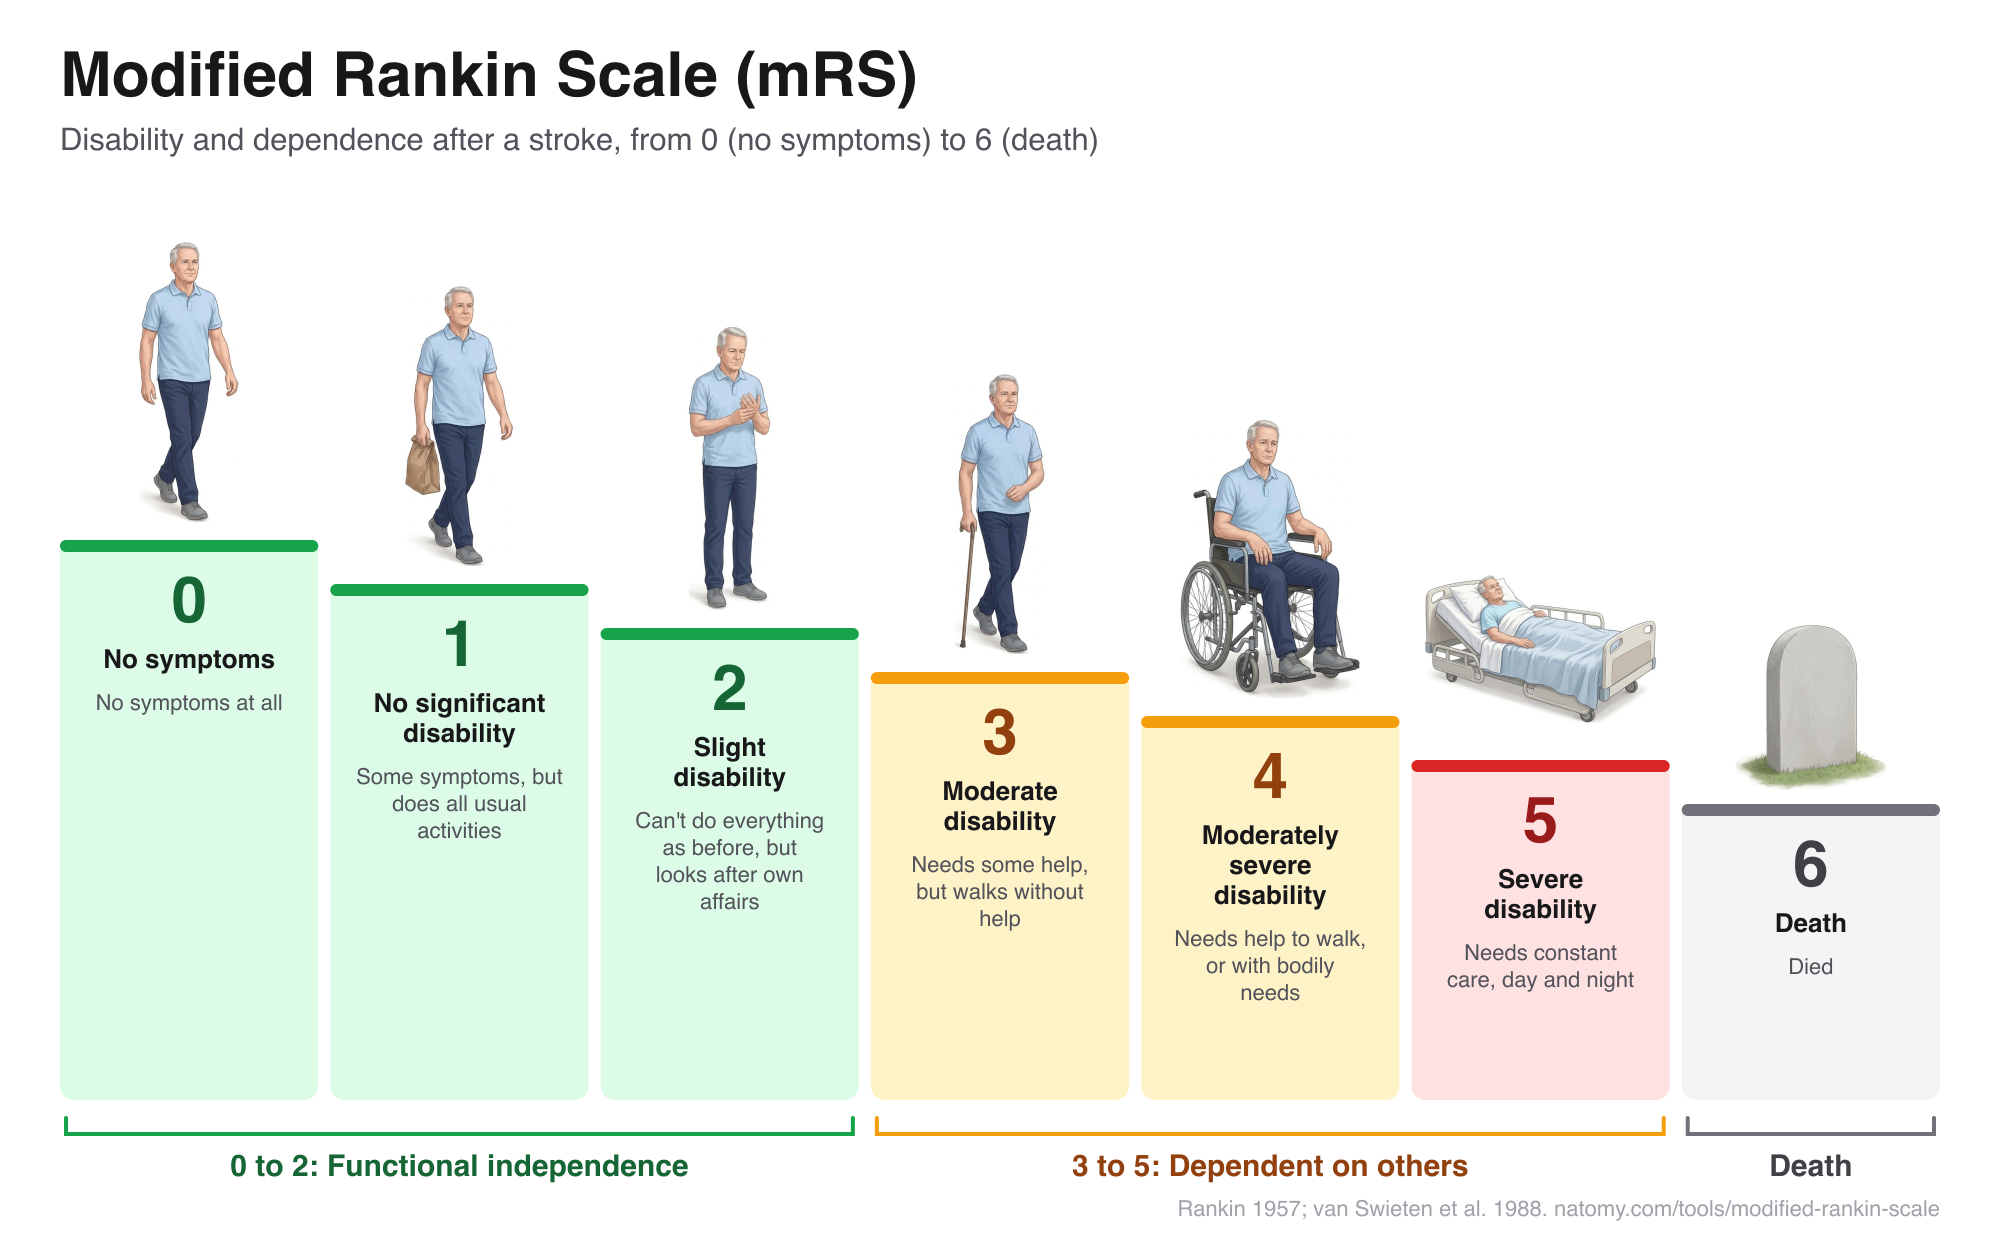
The modified Rankin scale grades disability after a stroke from 0 (no symptoms) to 6 (death). Grades 0 to 2 mean the person is still independent, and 3 to 5 mean they depend on others, from needing some help to needing care day and night. Answer a few questions below to find the grade and copy a note.
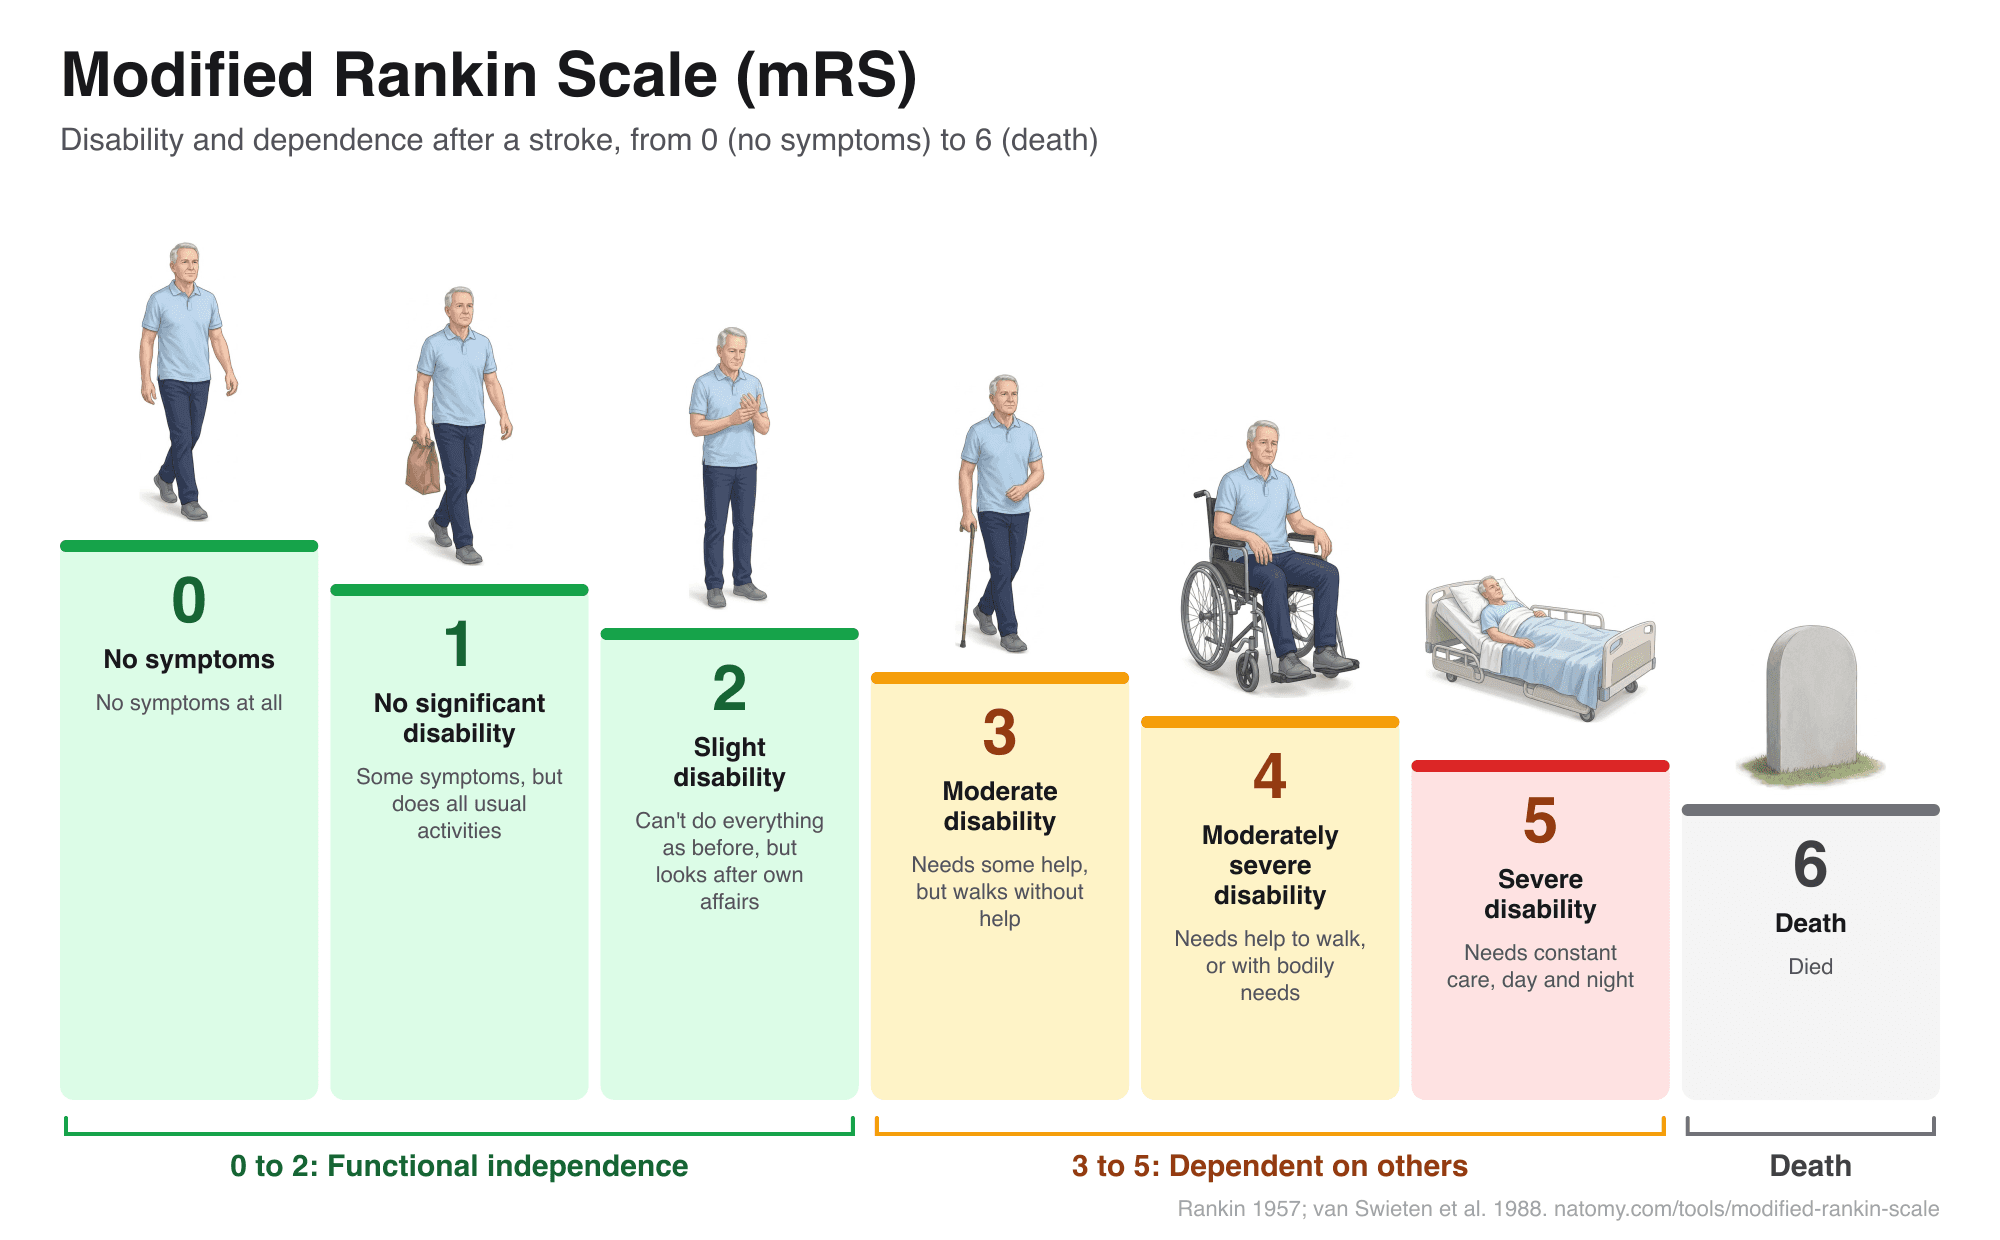
Download the chart (PNG) for teaching, patient education, or case files.
Answer from what the person actually does now, day to day, not what they might be able to do.
Or pick a grade
No symptoms at all from the stroke. Life is the same as before.

Has some symptoms, such as mild weakness, numbness, or trouble finding words, but can still do everything they did before: work, hobbies, family and social life.

Has had to give up or cut back on some activities, such as a job, driving, or a sport, but looks after their own affairs without help from anyone.
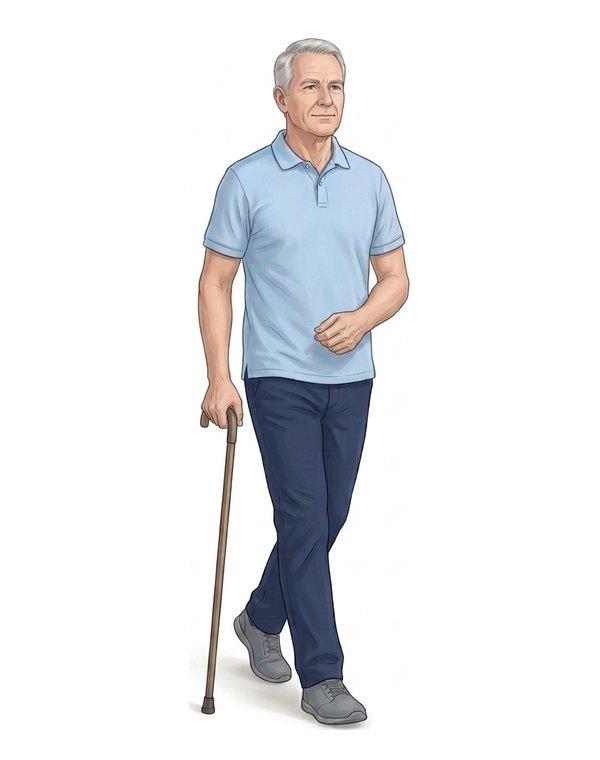
Needs some help from another person with daily life, such as shopping, cooking, managing money, or getting around town, but can walk without another person's help. A cane or walker is fine.
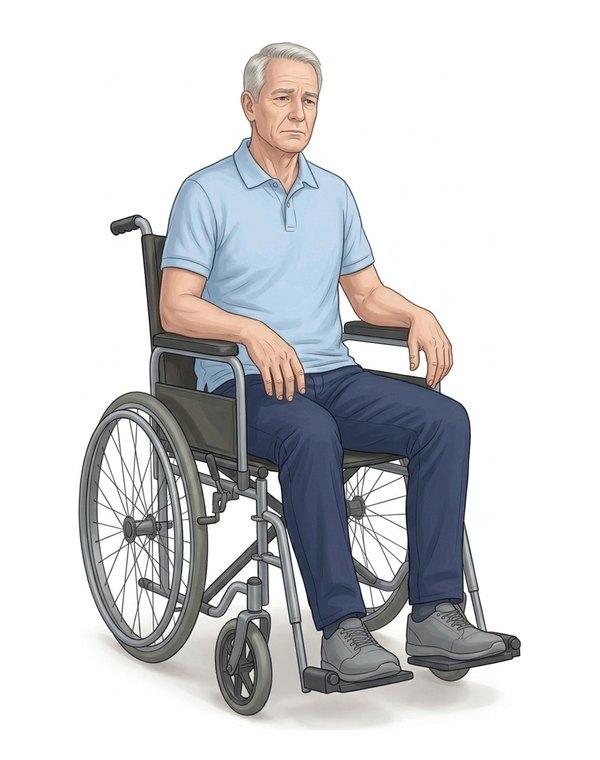
Needs another person's help to walk, or with bodily needs such as washing, dressing, using the toilet, or eating, but does not need care around the clock.
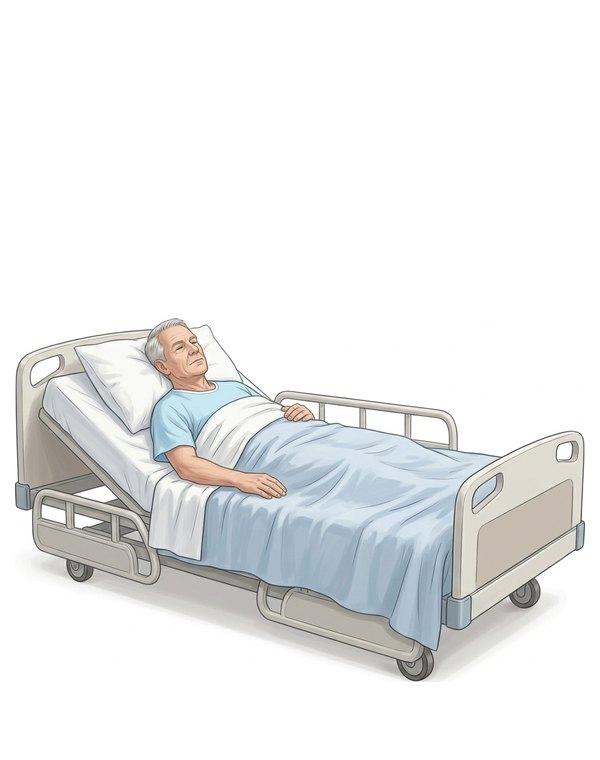
Needs someone available to care for them at all times, day and night. Often bedbound and incontinent.
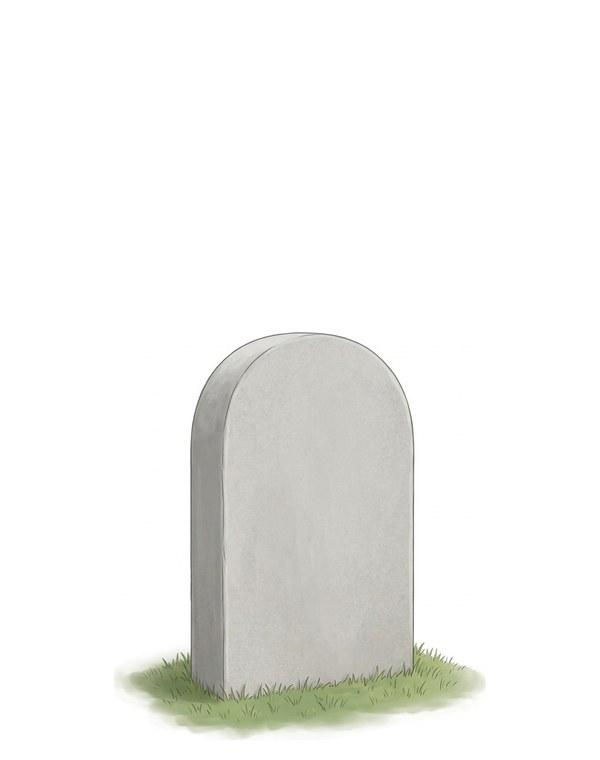
The person has died. Grade 6 is added in stroke trials so deaths are counted in the outcome.
Stroke trials usually measure the mRS 90 days after the stroke. A score of 0 to 2, functional independence, is the most common definition of a good outcome, and 0 to 1 is sometimes called an excellent outcome. Clot-busting drug trials such as NINDS and ECASS III reported more patients reaching mRS 0 to 1. Thrombectomy trials and their pooled HERMES analysis reported a shift toward lower grades across the whole scale, with more patients reaching mRS 0 to 2.
| Scale | Measures | Range | Usually used |
|---|---|---|---|
| NIH Stroke Scale | Neurological deficit: weakness, speech, vision, attention | 0 to 42 (higher is worse) | First hours and days |
| Modified Rankin Scale | Overall disability and dependence in daily life | 0 to 6 (higher is worse) | Discharge, 90 days, follow-up |
| Barthel Index | Independence in 10 basic activities, such as feeding, bathing, and walking | 0 to 100 (higher is better) | Rehabilitation |
In stroke malpractice cases, such as a stroke missed in the emergency department or a delay in clot-busting treatment or thrombectomy, the question is often how the outcome would have differed with timely care. Because treatment trials report their results on the mRS, experts often frame that question in mRS grades: for example, the chance the person would have been independent (mRS 0 to 2) with treatment, compared with the grade they actually reached. Courts differ on whether a lost chance of a better outcome is enough, or whether treatment must have more likely than not changed the grade.
The grades in the records also track the course of recovery, from discharge through rehabilitation, and the grade where the person leveled off drives the care they will need. A person at mRS 4, for example, needs another person's help to walk or with personal care every day, which is central to a life care plan and the cost of future care.
Dr. John Rankin of Glasgow described the original scale in 1957, with five grades of disability in older adults after a stroke. It was modified in the late 1980s for the UK-TIA aspirin trial, adding grade 0 for no symptoms and rewording grades 1 and 2, and the modified version was published in 1988. Grade 6, death, was added in later trials so every patient could be counted.
Natomy turns CT and MRI scans, records, and prompts into clear, labeled medical illustrations of strokes, such as blocked arteries, the area of brain affected, and bleeding, for patient education and medical-legal exhibits. See examples in the Natomy atlas.
Try Natomy TodayThe modified Rankin scale (mRS) measures how much disability and dependence a person has after a stroke, on a scale from 0 (no symptoms) to 6 (death). It is the most widely used outcome measure in stroke trials and is also used in clinics, rehabilitation, and medical records.
A score of 0 to 2 means the person is functionally independent: they look after their own affairs without help, even if they have some symptoms or have had to give up some activities. Many stroke trials count mRS 0 to 2 at 90 days as a good outcome, others use 0 to 1, and many now analyze the whole scale.
The line between 2 and 3 is whether the person needs help from someone else in daily life. At grade 2 they manage their own affairs, such as shopping, cooking, money, and getting around, without help. At grade 3 they need some help with these tasks, but can still walk without another person's help.
Not by itself. Walking with a cane, walker, or brace on your own counts as walking without assistance, which fits grade 3 or better. Grade 4 means the person needs another person's help to walk, or with bodily needs such as washing, dressing, using the toilet, or eating.
It can be graded at any time, but stroke trials usually measure it 90 days after the stroke. It is also often recorded at hospital discharge, at follow-up visits, and as a pre-stroke score to show how the person was doing before the stroke.
The NIH Stroke Scale measures the neurological deficit, such as weakness, speech, and vision problems, usually in the first hours and days. The modified Rankin scale measures the effect on everyday life, usually weeks to months later. A person can have a low NIHSS score but a higher mRS if a small deficit affects their work or independence.
Dr. John Rankin, a Scottish physician, described the original 5-grade scale in 1957 in a study of older adults after stroke. It was modified in the late 1980s for the UK-TIA aspirin trial, which added grade 0 for no symptoms and reworded grades 1 and 2. Grade 6, death, was added in later trials so every patient could be counted.
Agreement between two raters is only moderate when the grade comes from an informal conversation. Using a structured interview or a short structured questionnaire, which asks the same questions in the same order, makes the grade more consistent.
Sources: Rankin J. Cerebral vascular accidents in patients over the age of 60. Scott Med J. 1957;2:200-215. van Swieten JC, et al. Interobserver agreement for the assessment of handicap in stroke patients. Stroke. 1988;19:604-607. Wilson JTL, et al. Improving the assessment of outcomes in stroke: use of a structured interview to assign grades on the modified Rankin Scale. Stroke. 2002;33:2243-2246. Bruno A, et al. Improving modified Rankin Scale assessment with a simplified questionnaire. Stroke. 2010;41:1048-1050. Banks JL, Marotta CA. Outcomes validity and reliability of the modified Rankin scale. Stroke. 2007;38:1091-1096. Descriptions and questions are written in our own words. For education and documentation only.
Free Online DICOM Viewer (3D)
Open a CT or MRI DICOM folder in your browser and view it in 3D, with AI anatomy labeling. Nothing is uploaded.
Try it free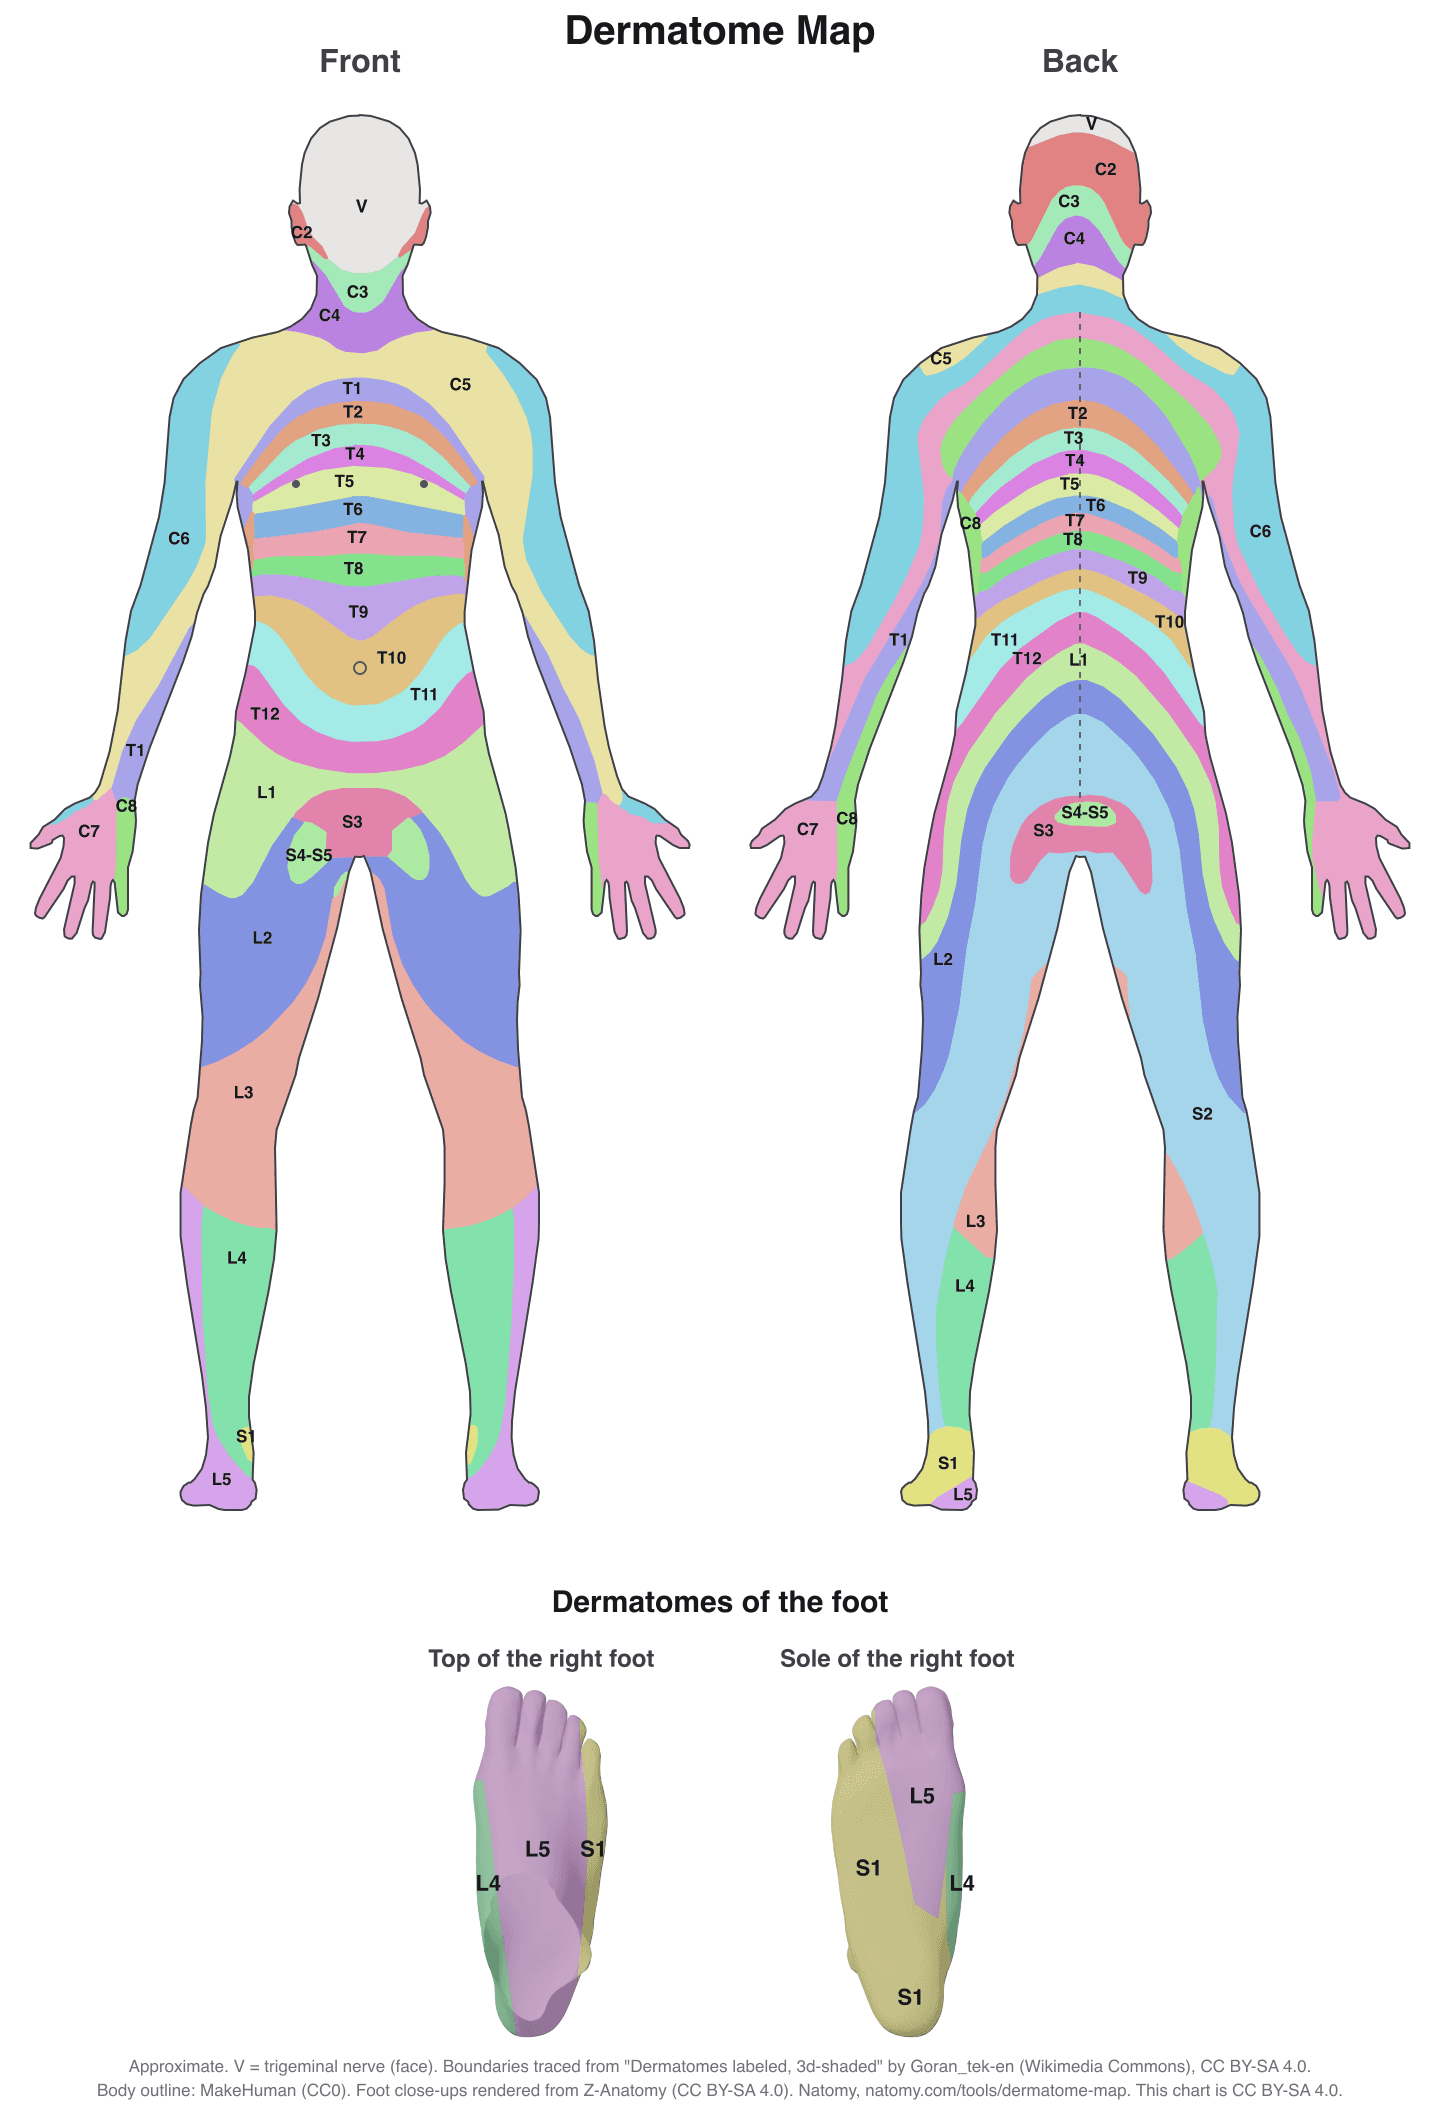
Interactive Dermatome Map
Tap the body to see each nerve root's skin area, test point, myotome, reflex, and disc level. Free printable chart.
Try it free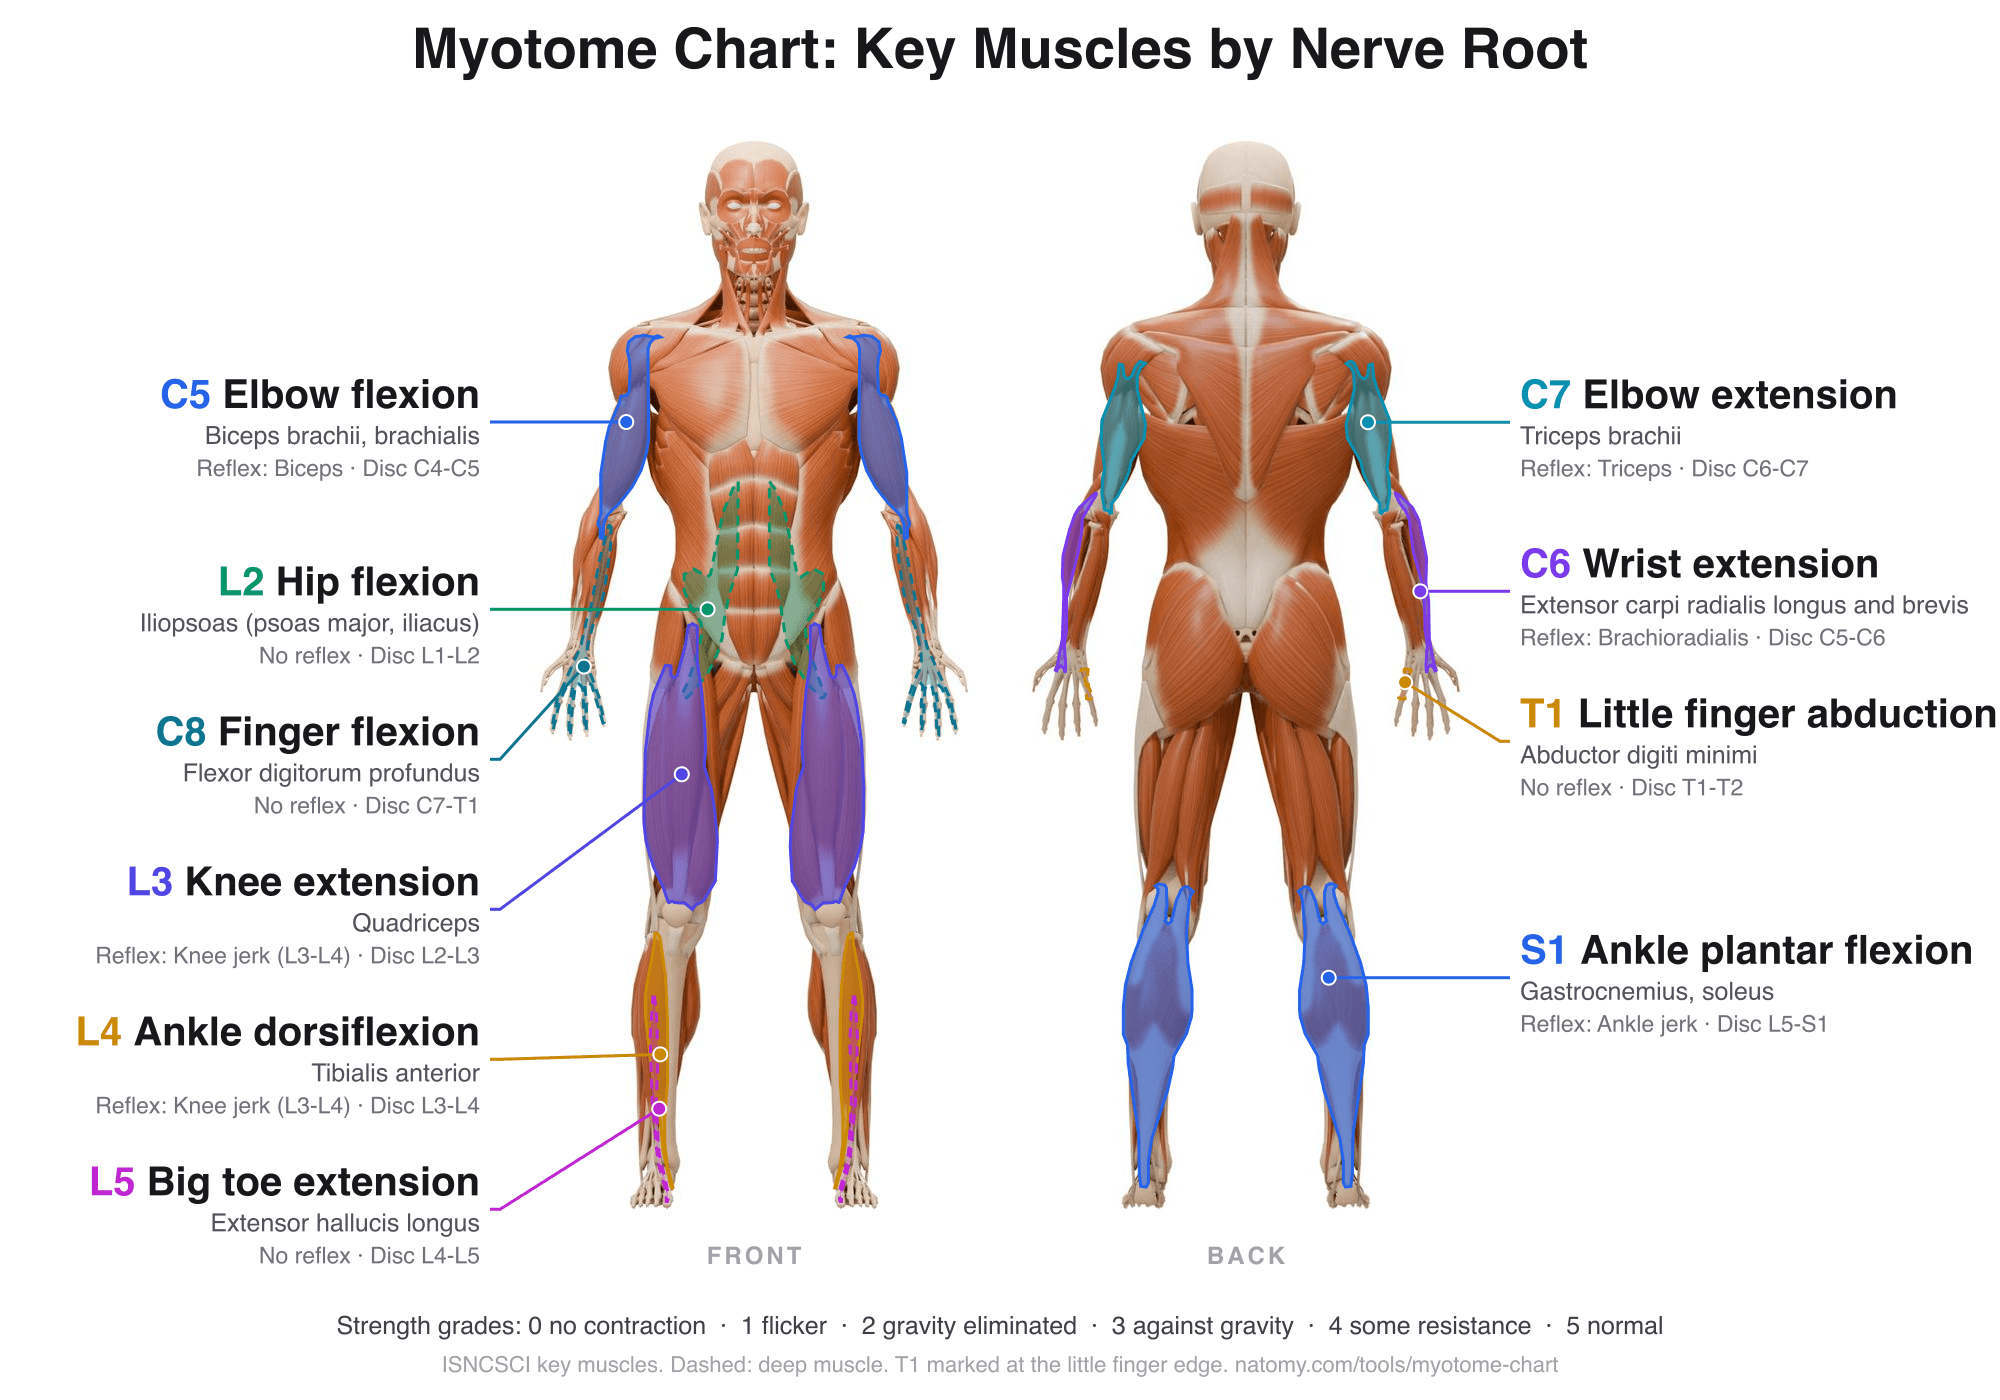
Myotome Chart and Motor Score
Tap a nerve root to see its key muscle, test position, and reflex. Grade strength 0 to 5 for the ISNCSCI motor score.
Try it free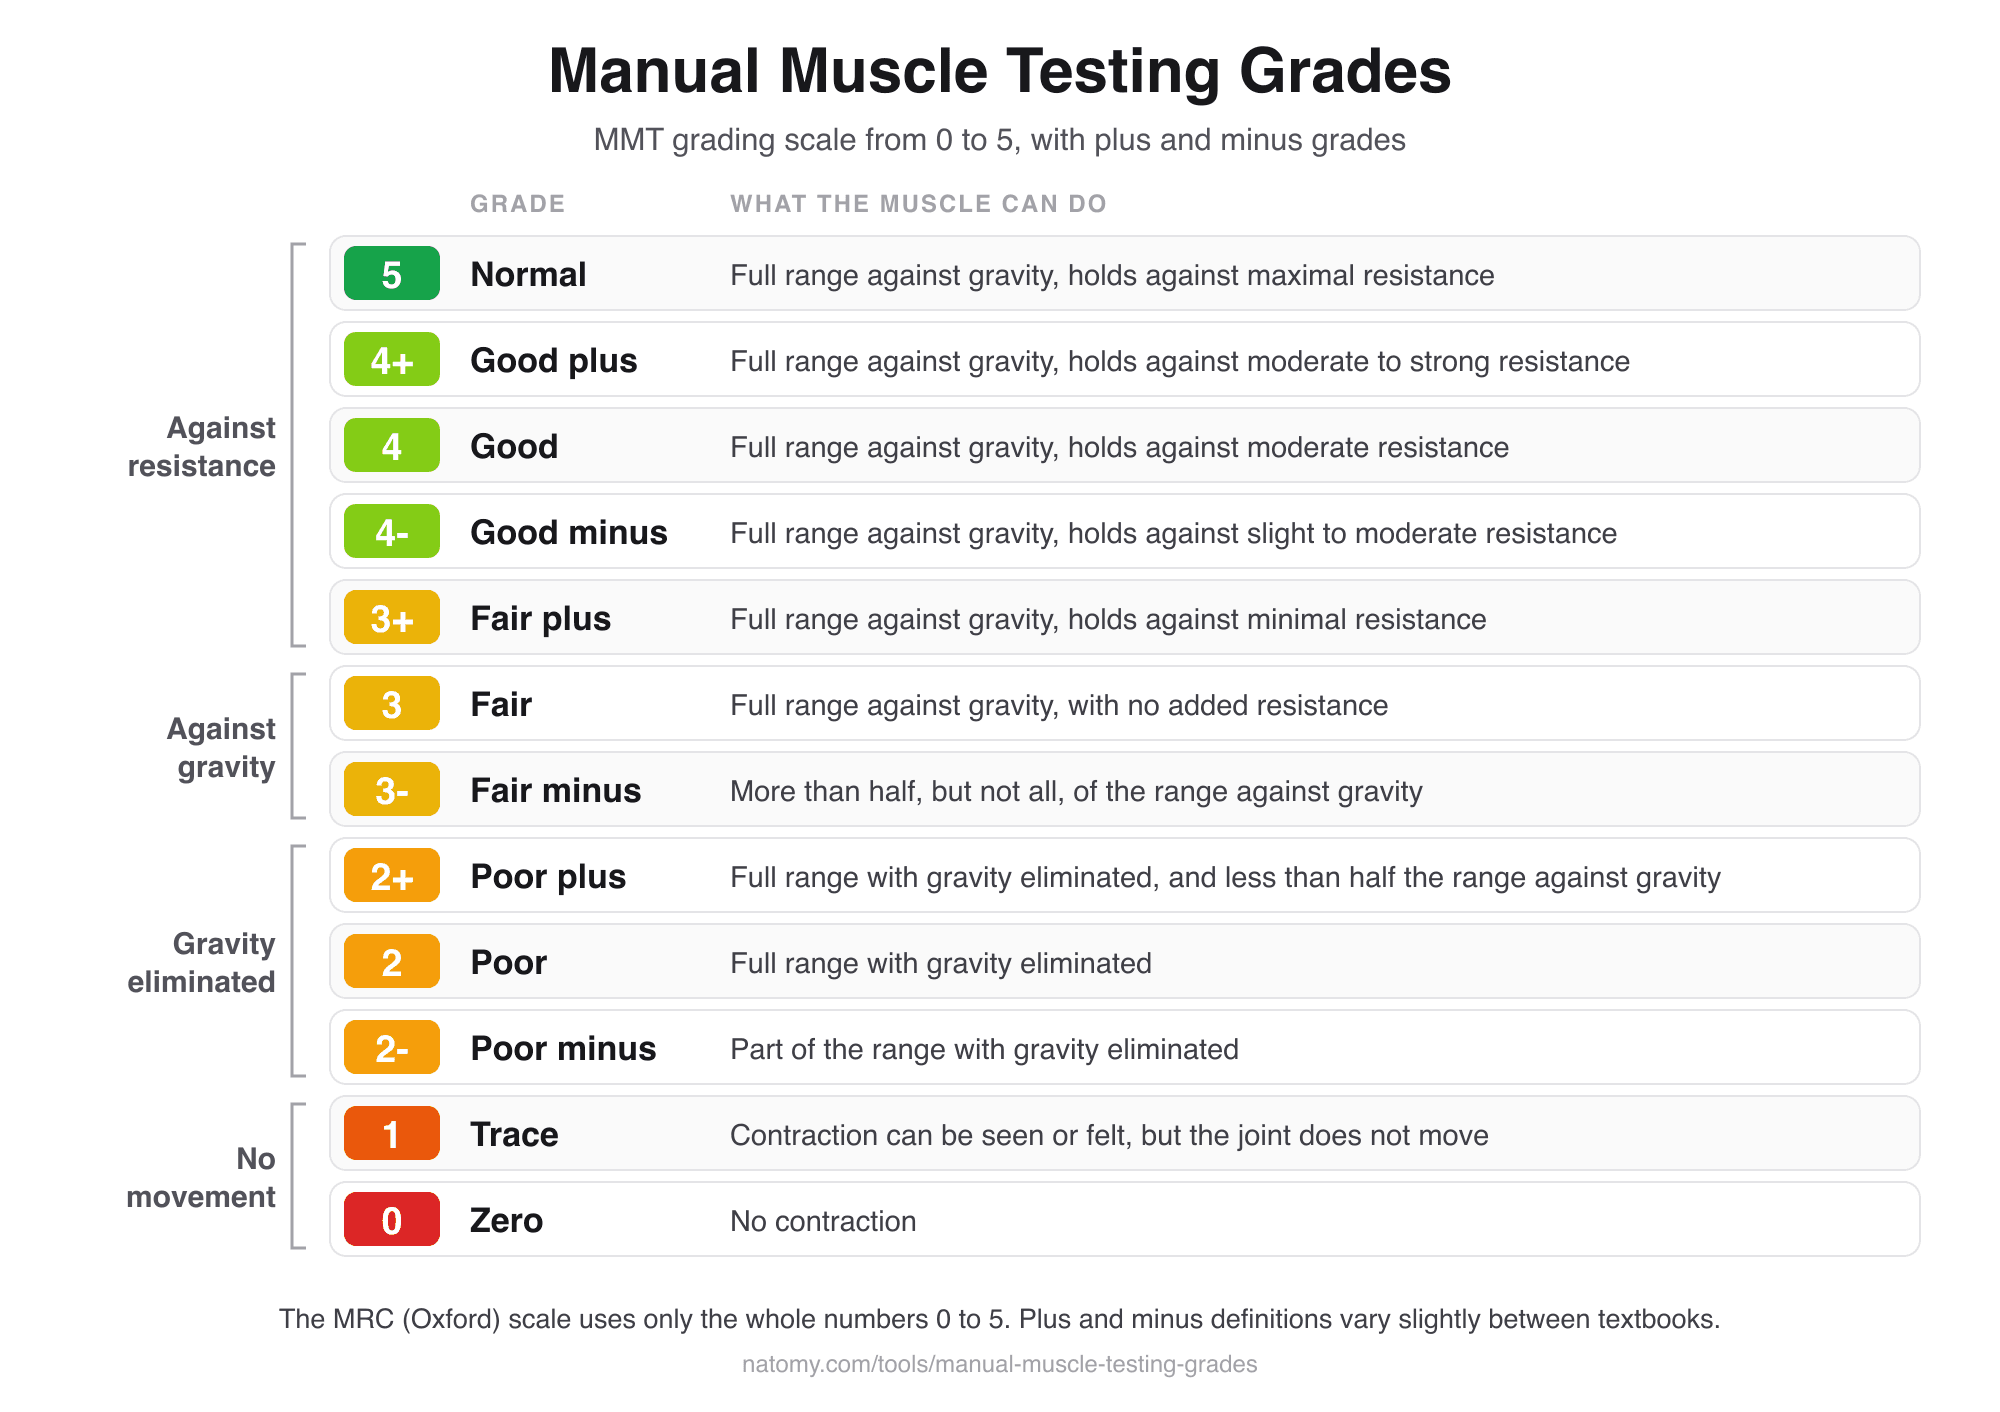
Manual Muscle Testing Grades
MMT grading scale chart from 0 to 5 with plus and minus grades, and a grade finder that writes the note for you.
Try it free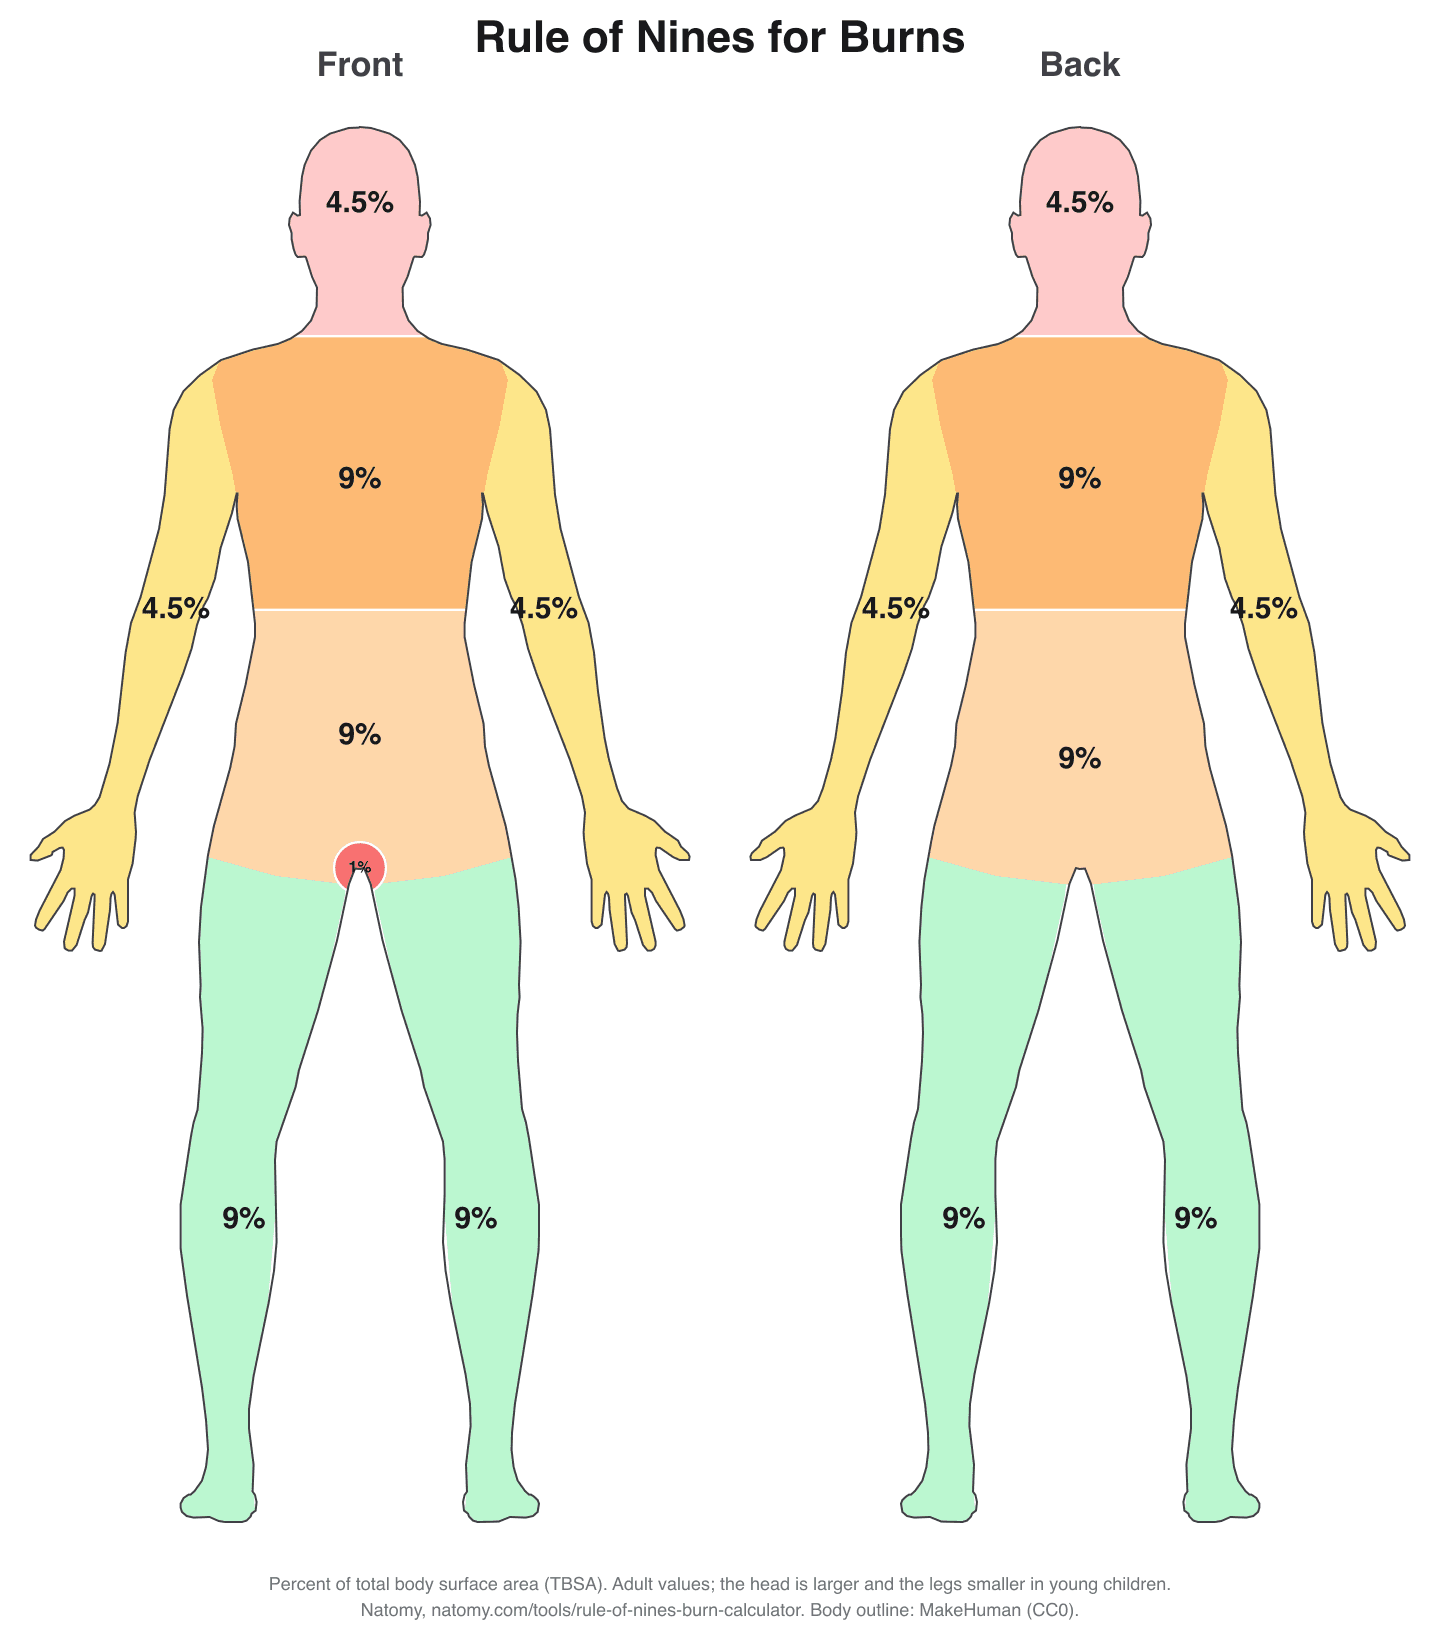
Rule of Nines Burn Calculator
Click the burned areas to get the total body surface area (TBSA), with the Parkland formula and a printable burn chart.
Try it free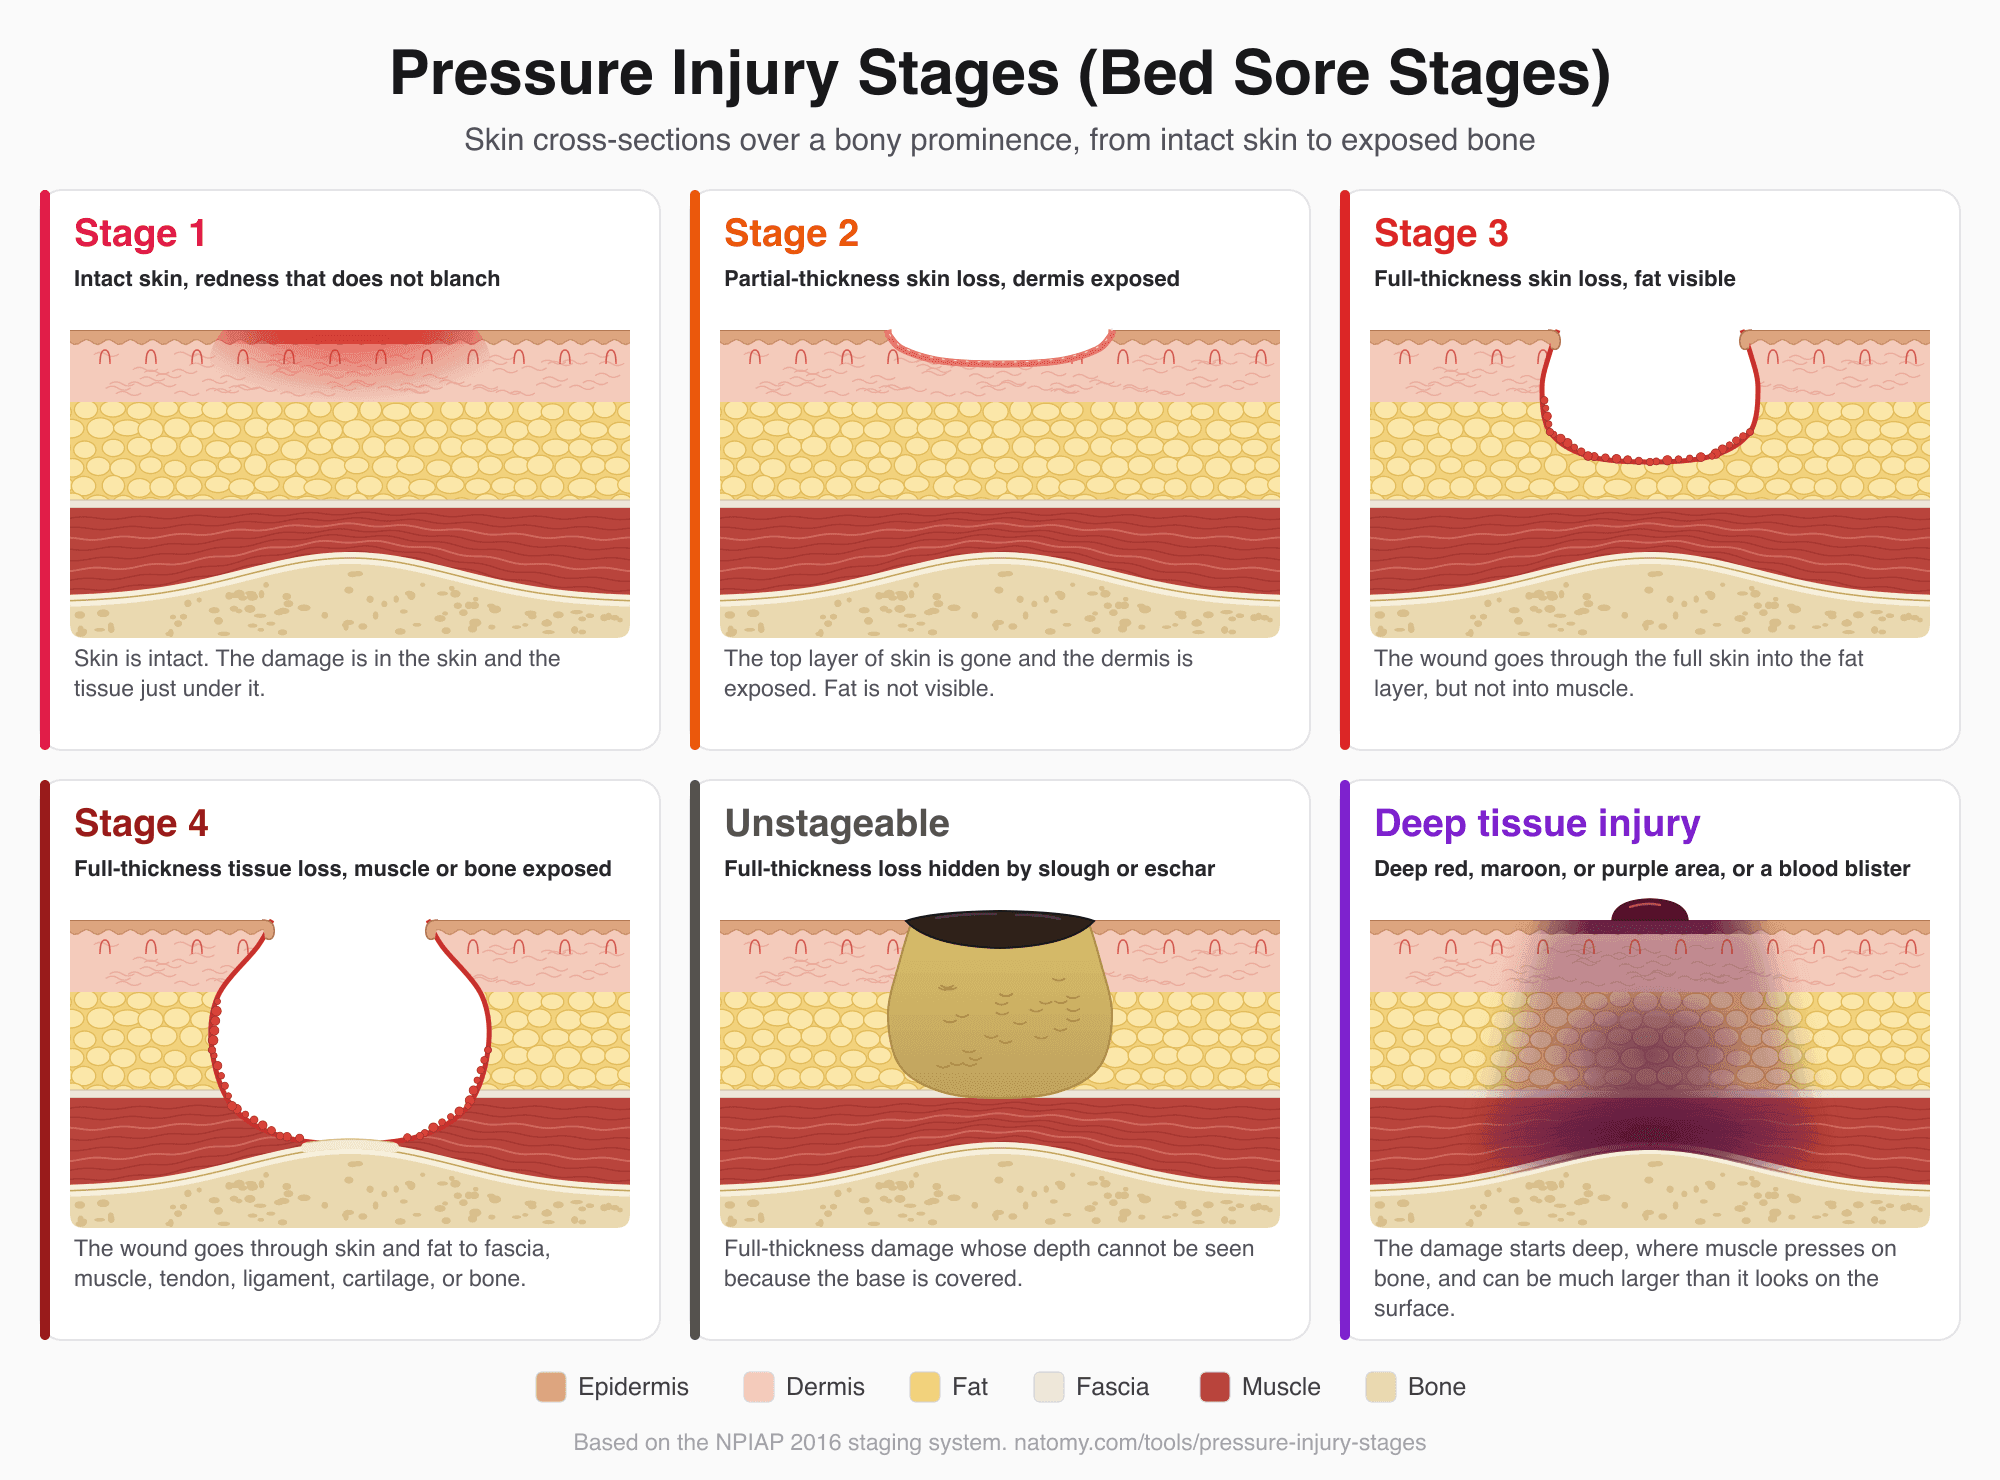
Pressure Injury (Bed Sore) Stages
Illustrated pressure ulcer stages chart, Stage 1 to 4, unstageable, and deep tissue injury, with a stage finder and wound note.
Try it free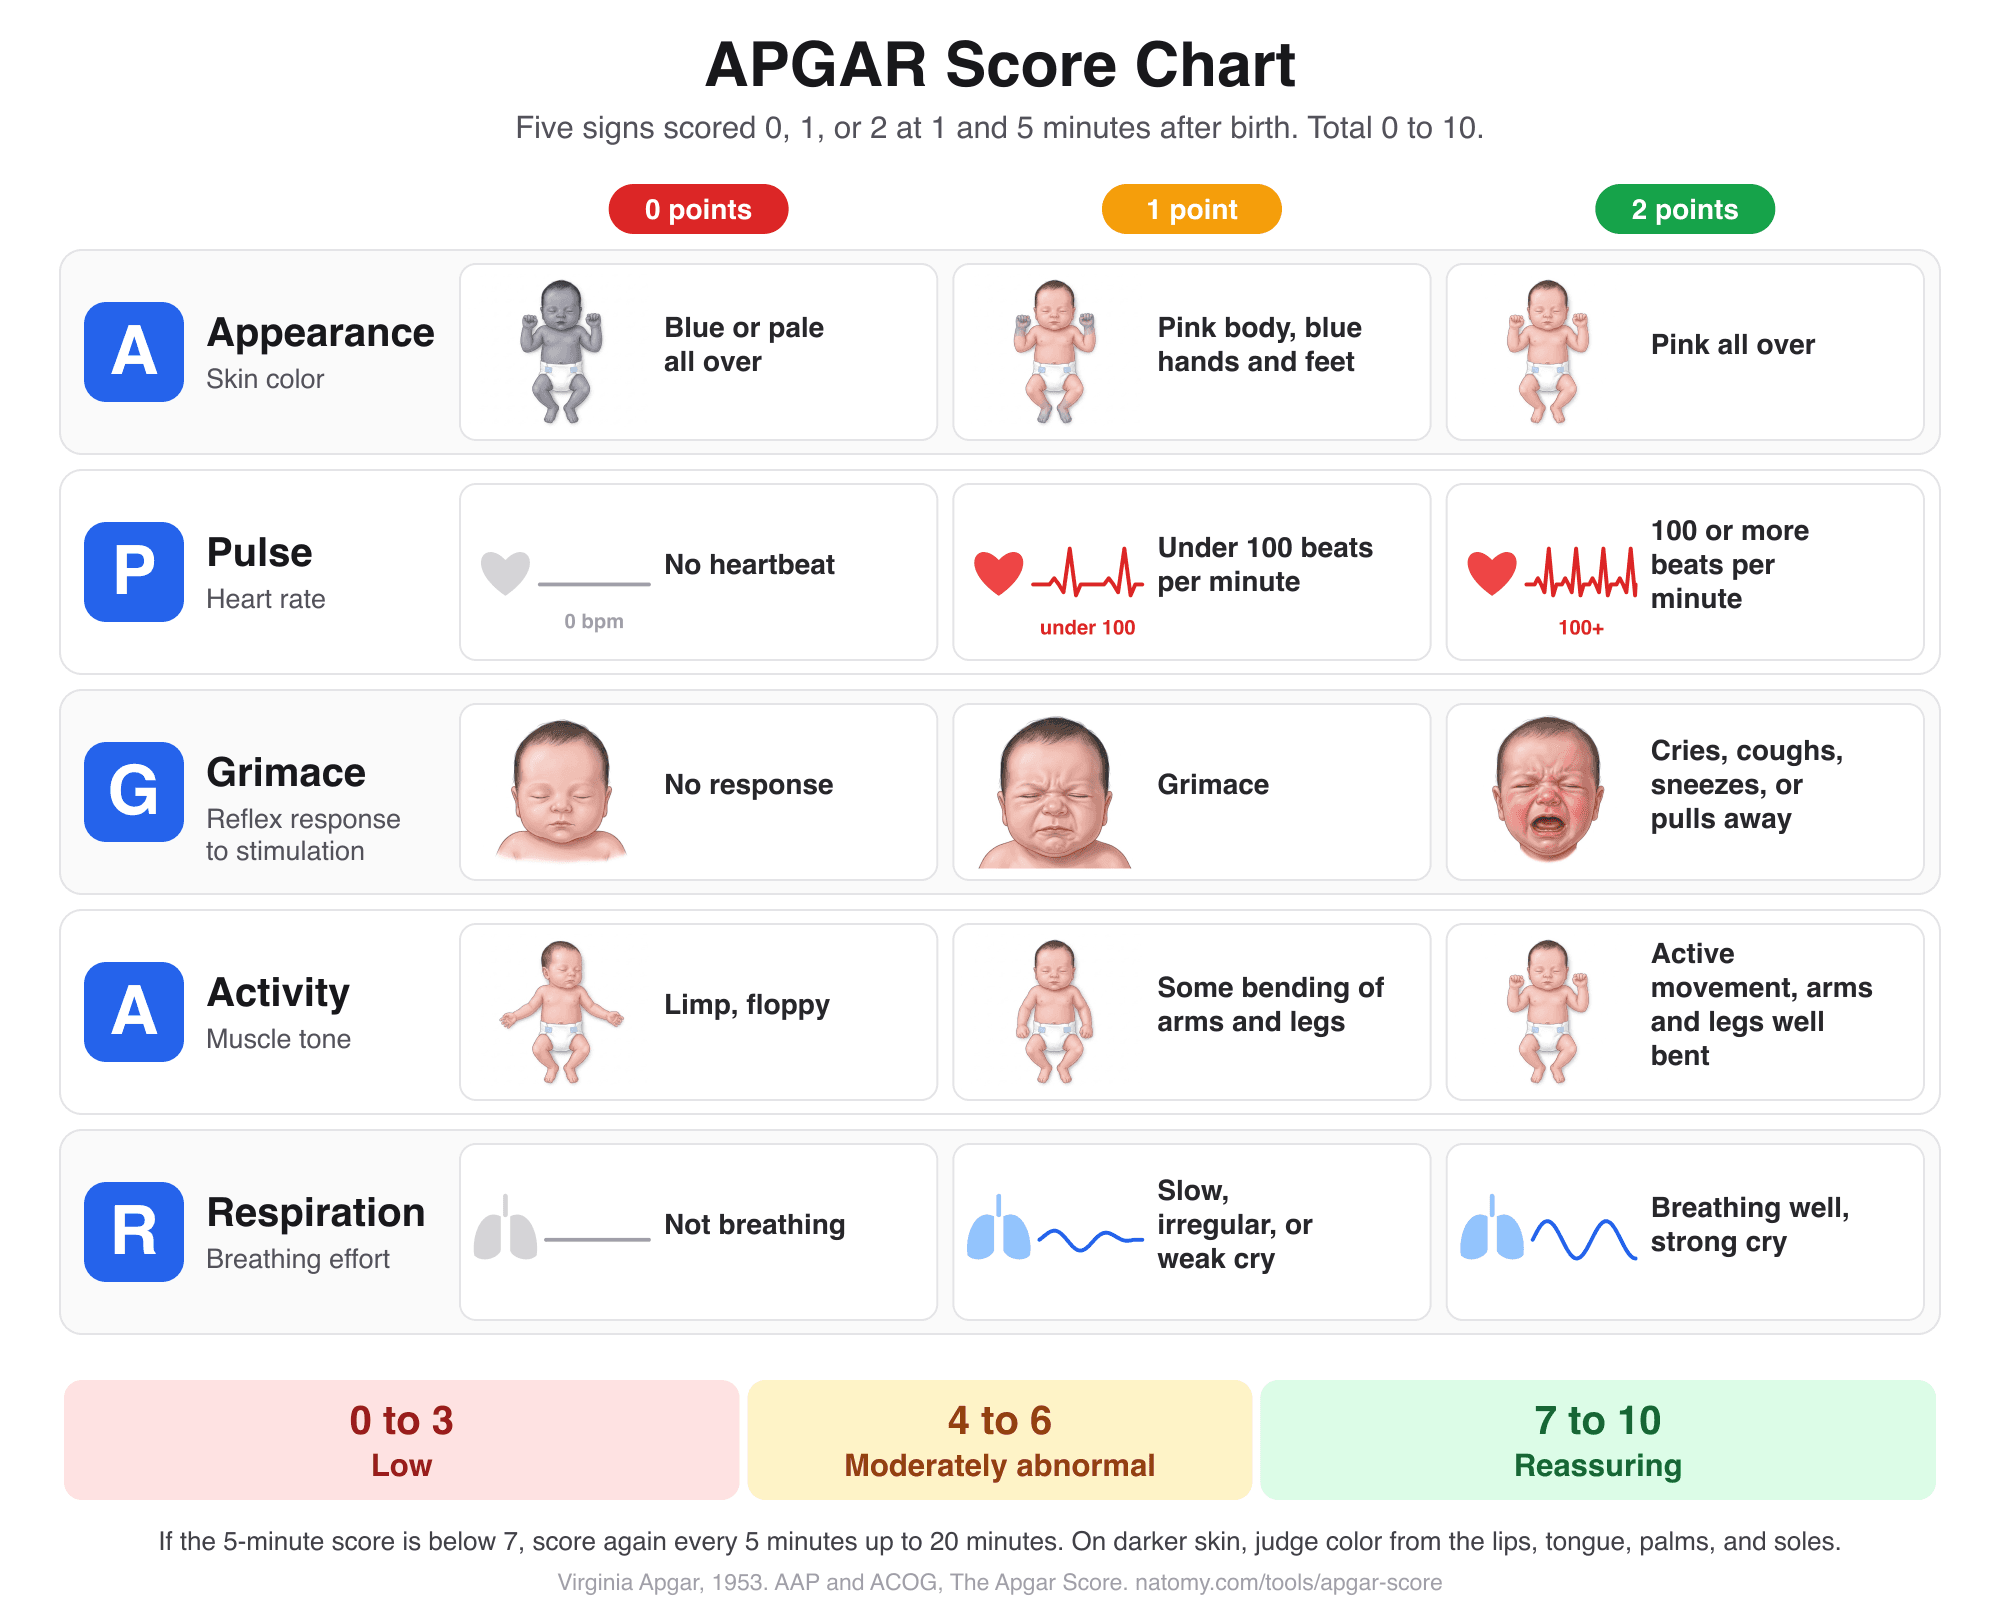
APGAR Score Chart and Calculator
Score the 5 newborn signs at 1, 5, and 10 minutes with an illustrated chart, what normal and low scores mean, and a note for the record.
Try it free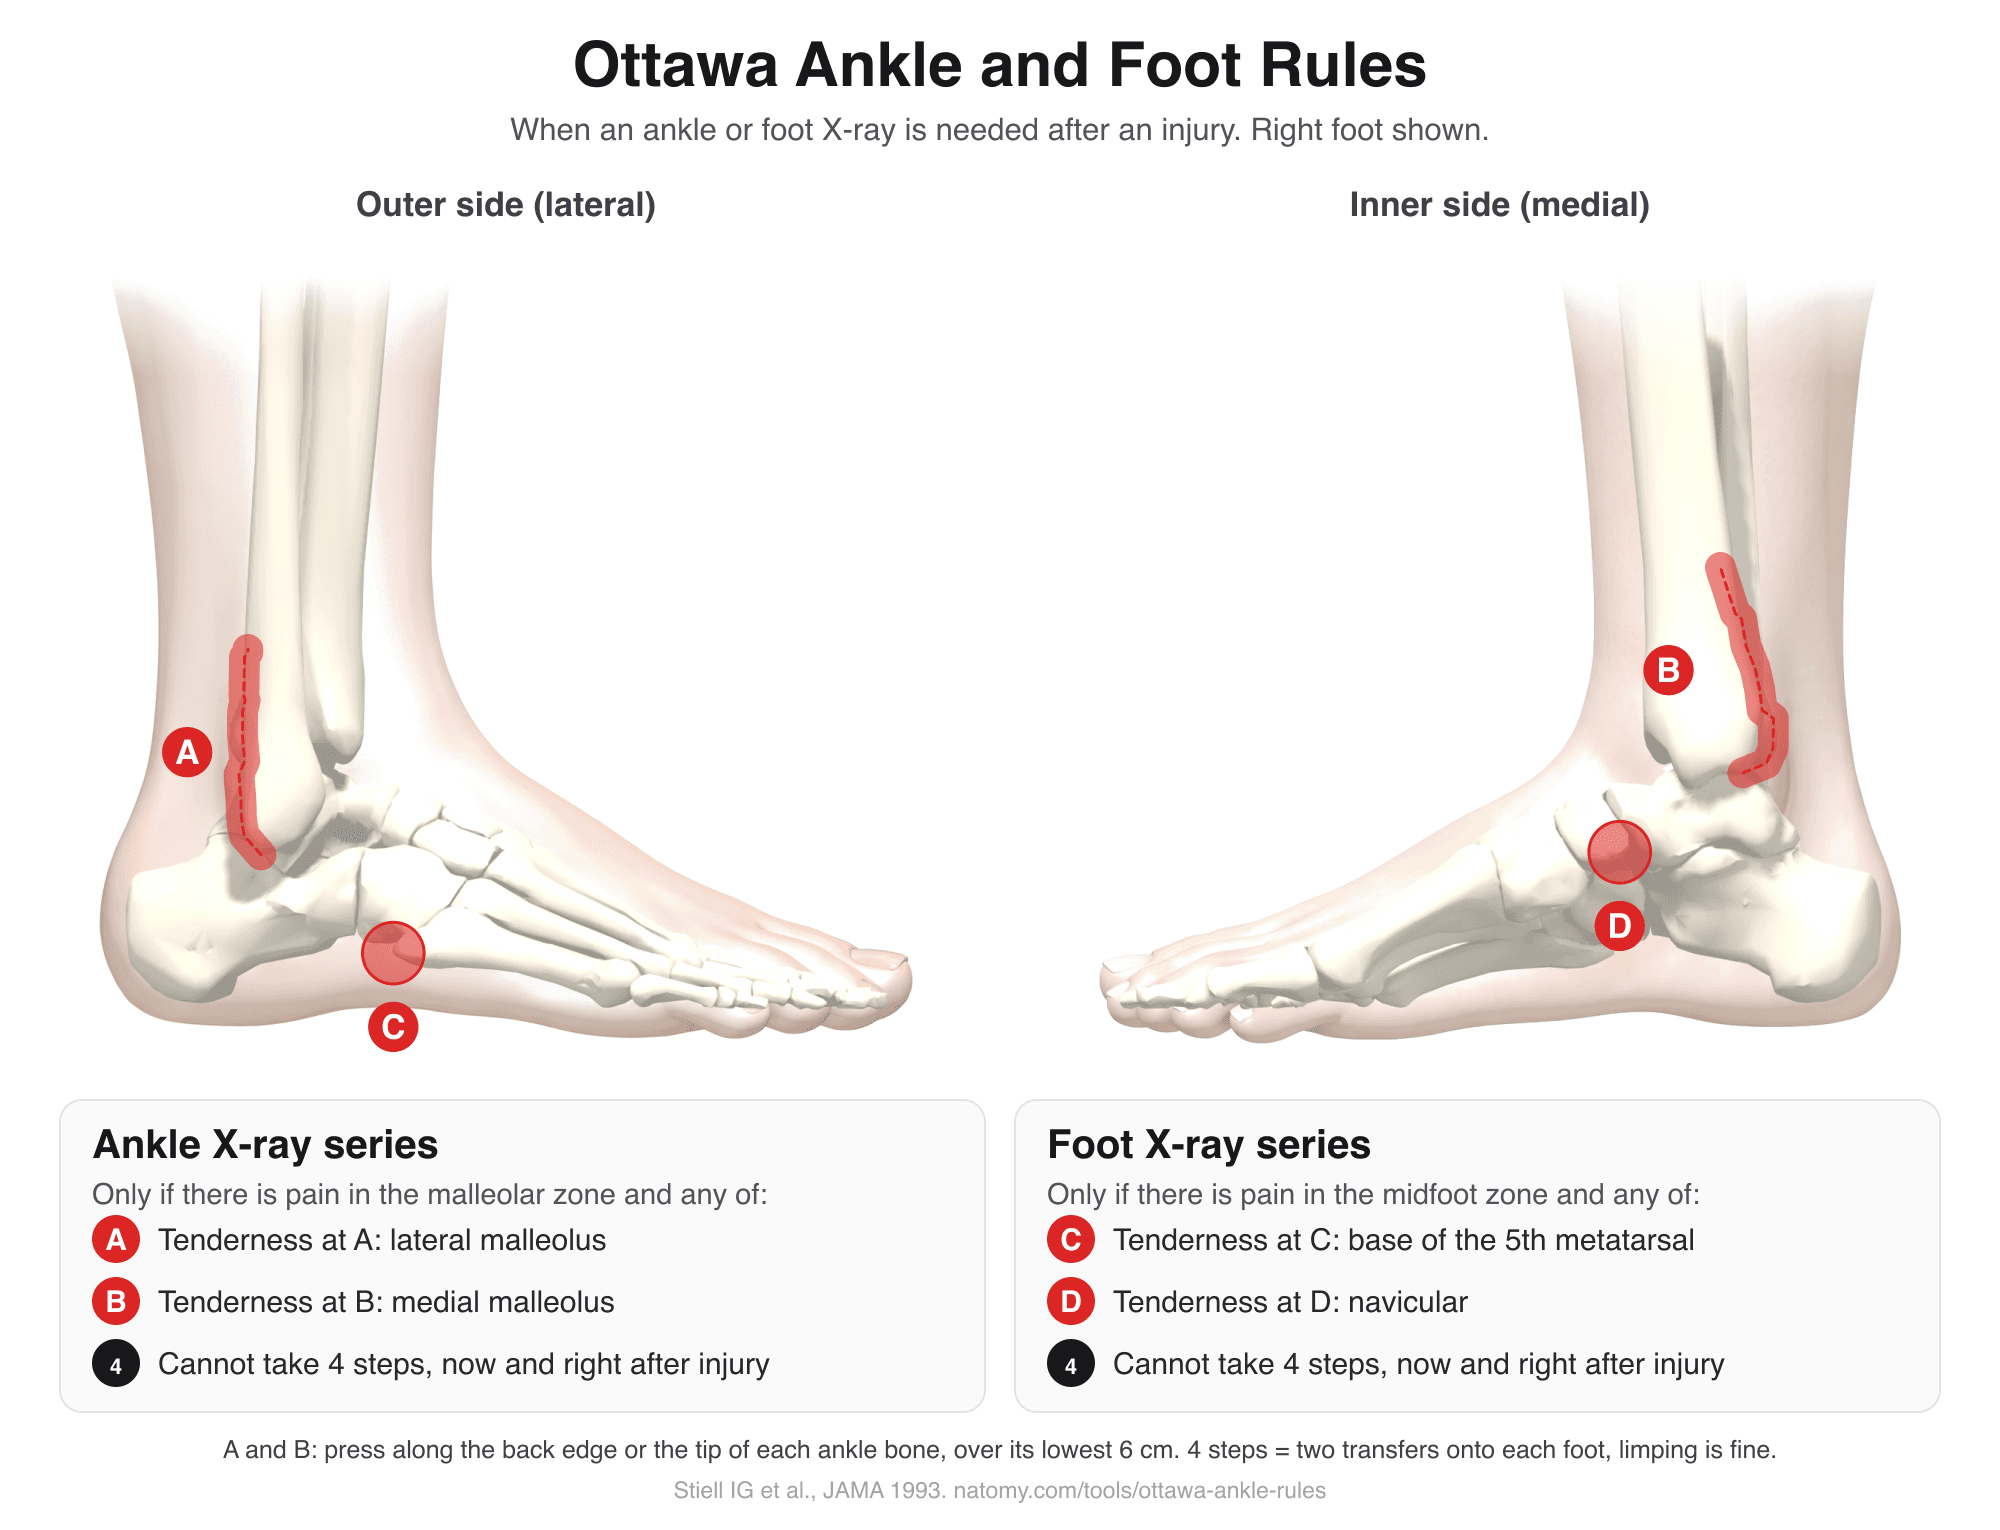
Ottawa Ankle Rules
Tap the tender spots on an illustrated ankle and foot to see if the Ottawa rules call for an X-ray. Includes the Ottawa knee rule.
Try it free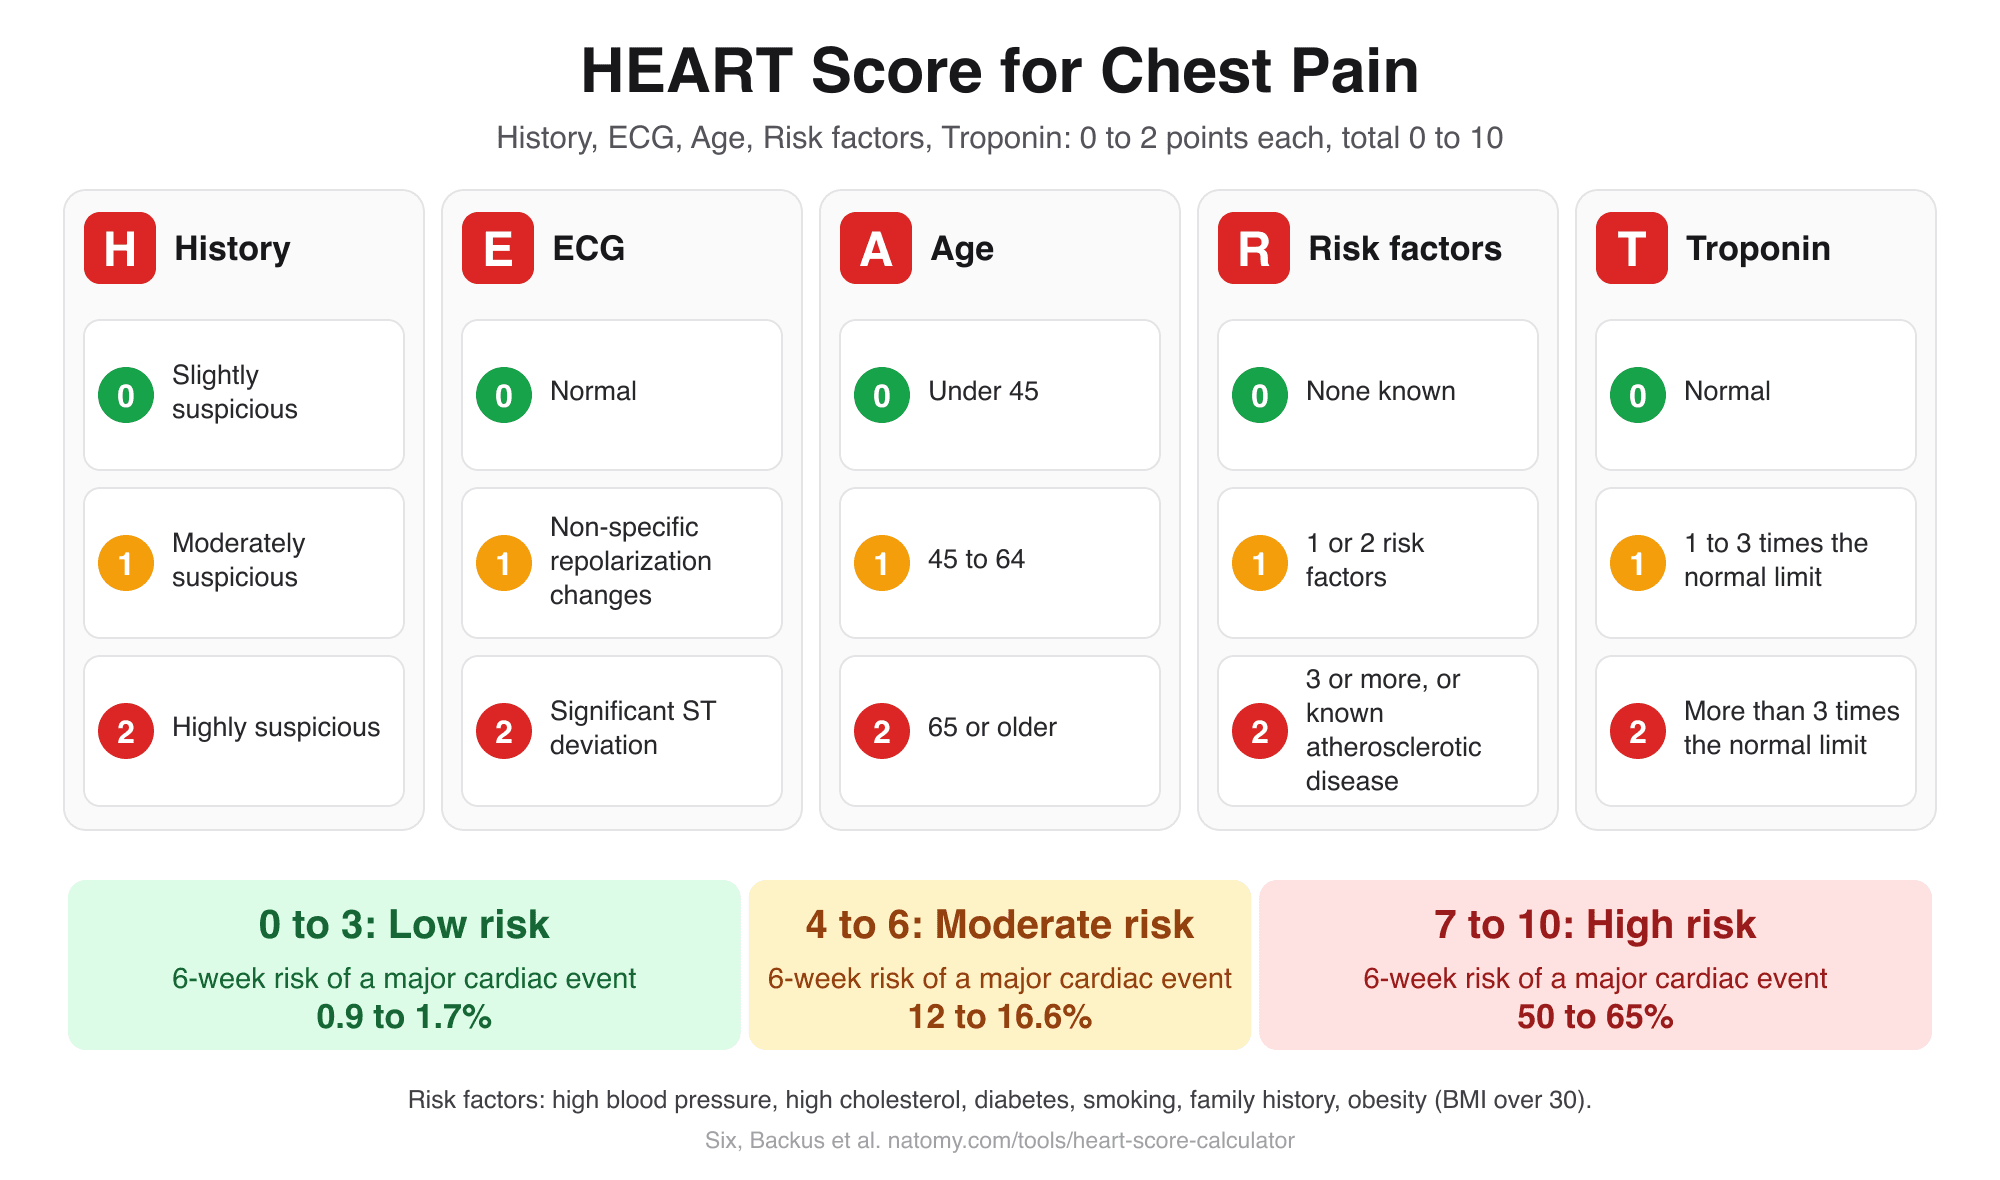
HEART Score Calculator
Score history, ECG, age, risk factors, and troponin for chest pain to get the HEART score, risk group, and 6-week MACE risk.
Try it free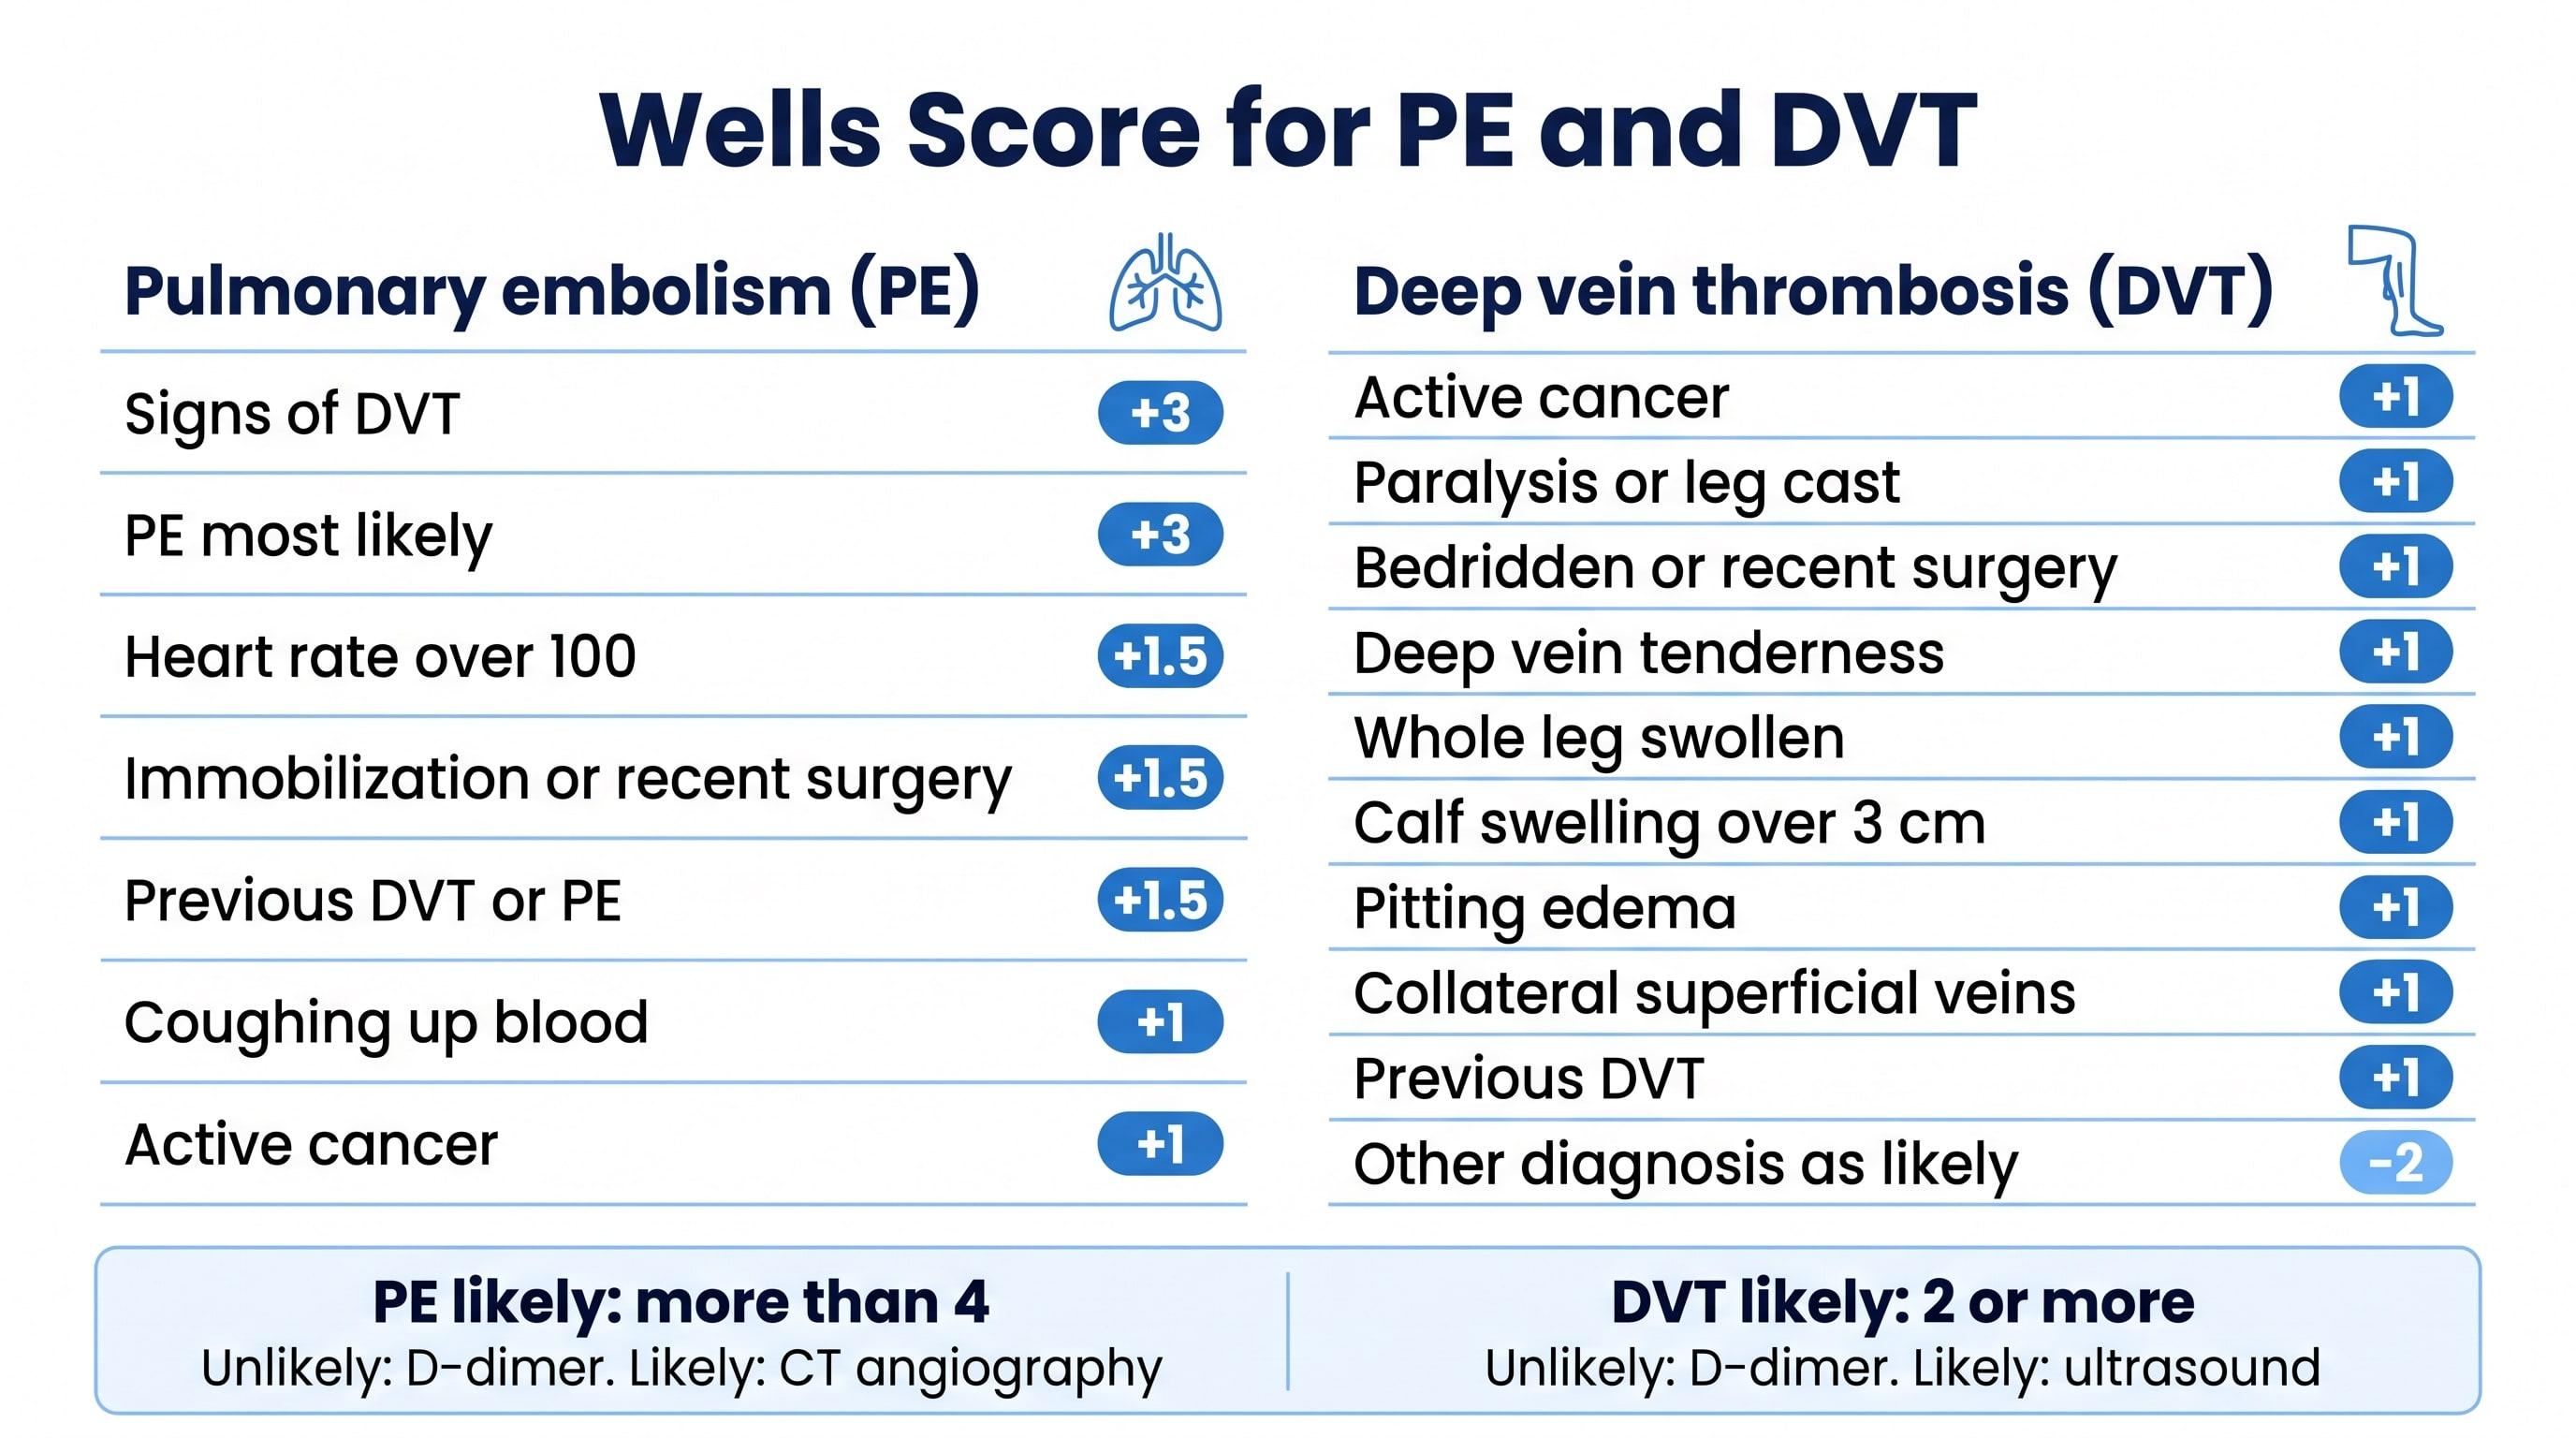
Wells Score Calculator (PE and DVT)
Check the Wells criteria for pulmonary embolism or deep vein thrombosis to get the score, the risk group, and the next test.
Try it free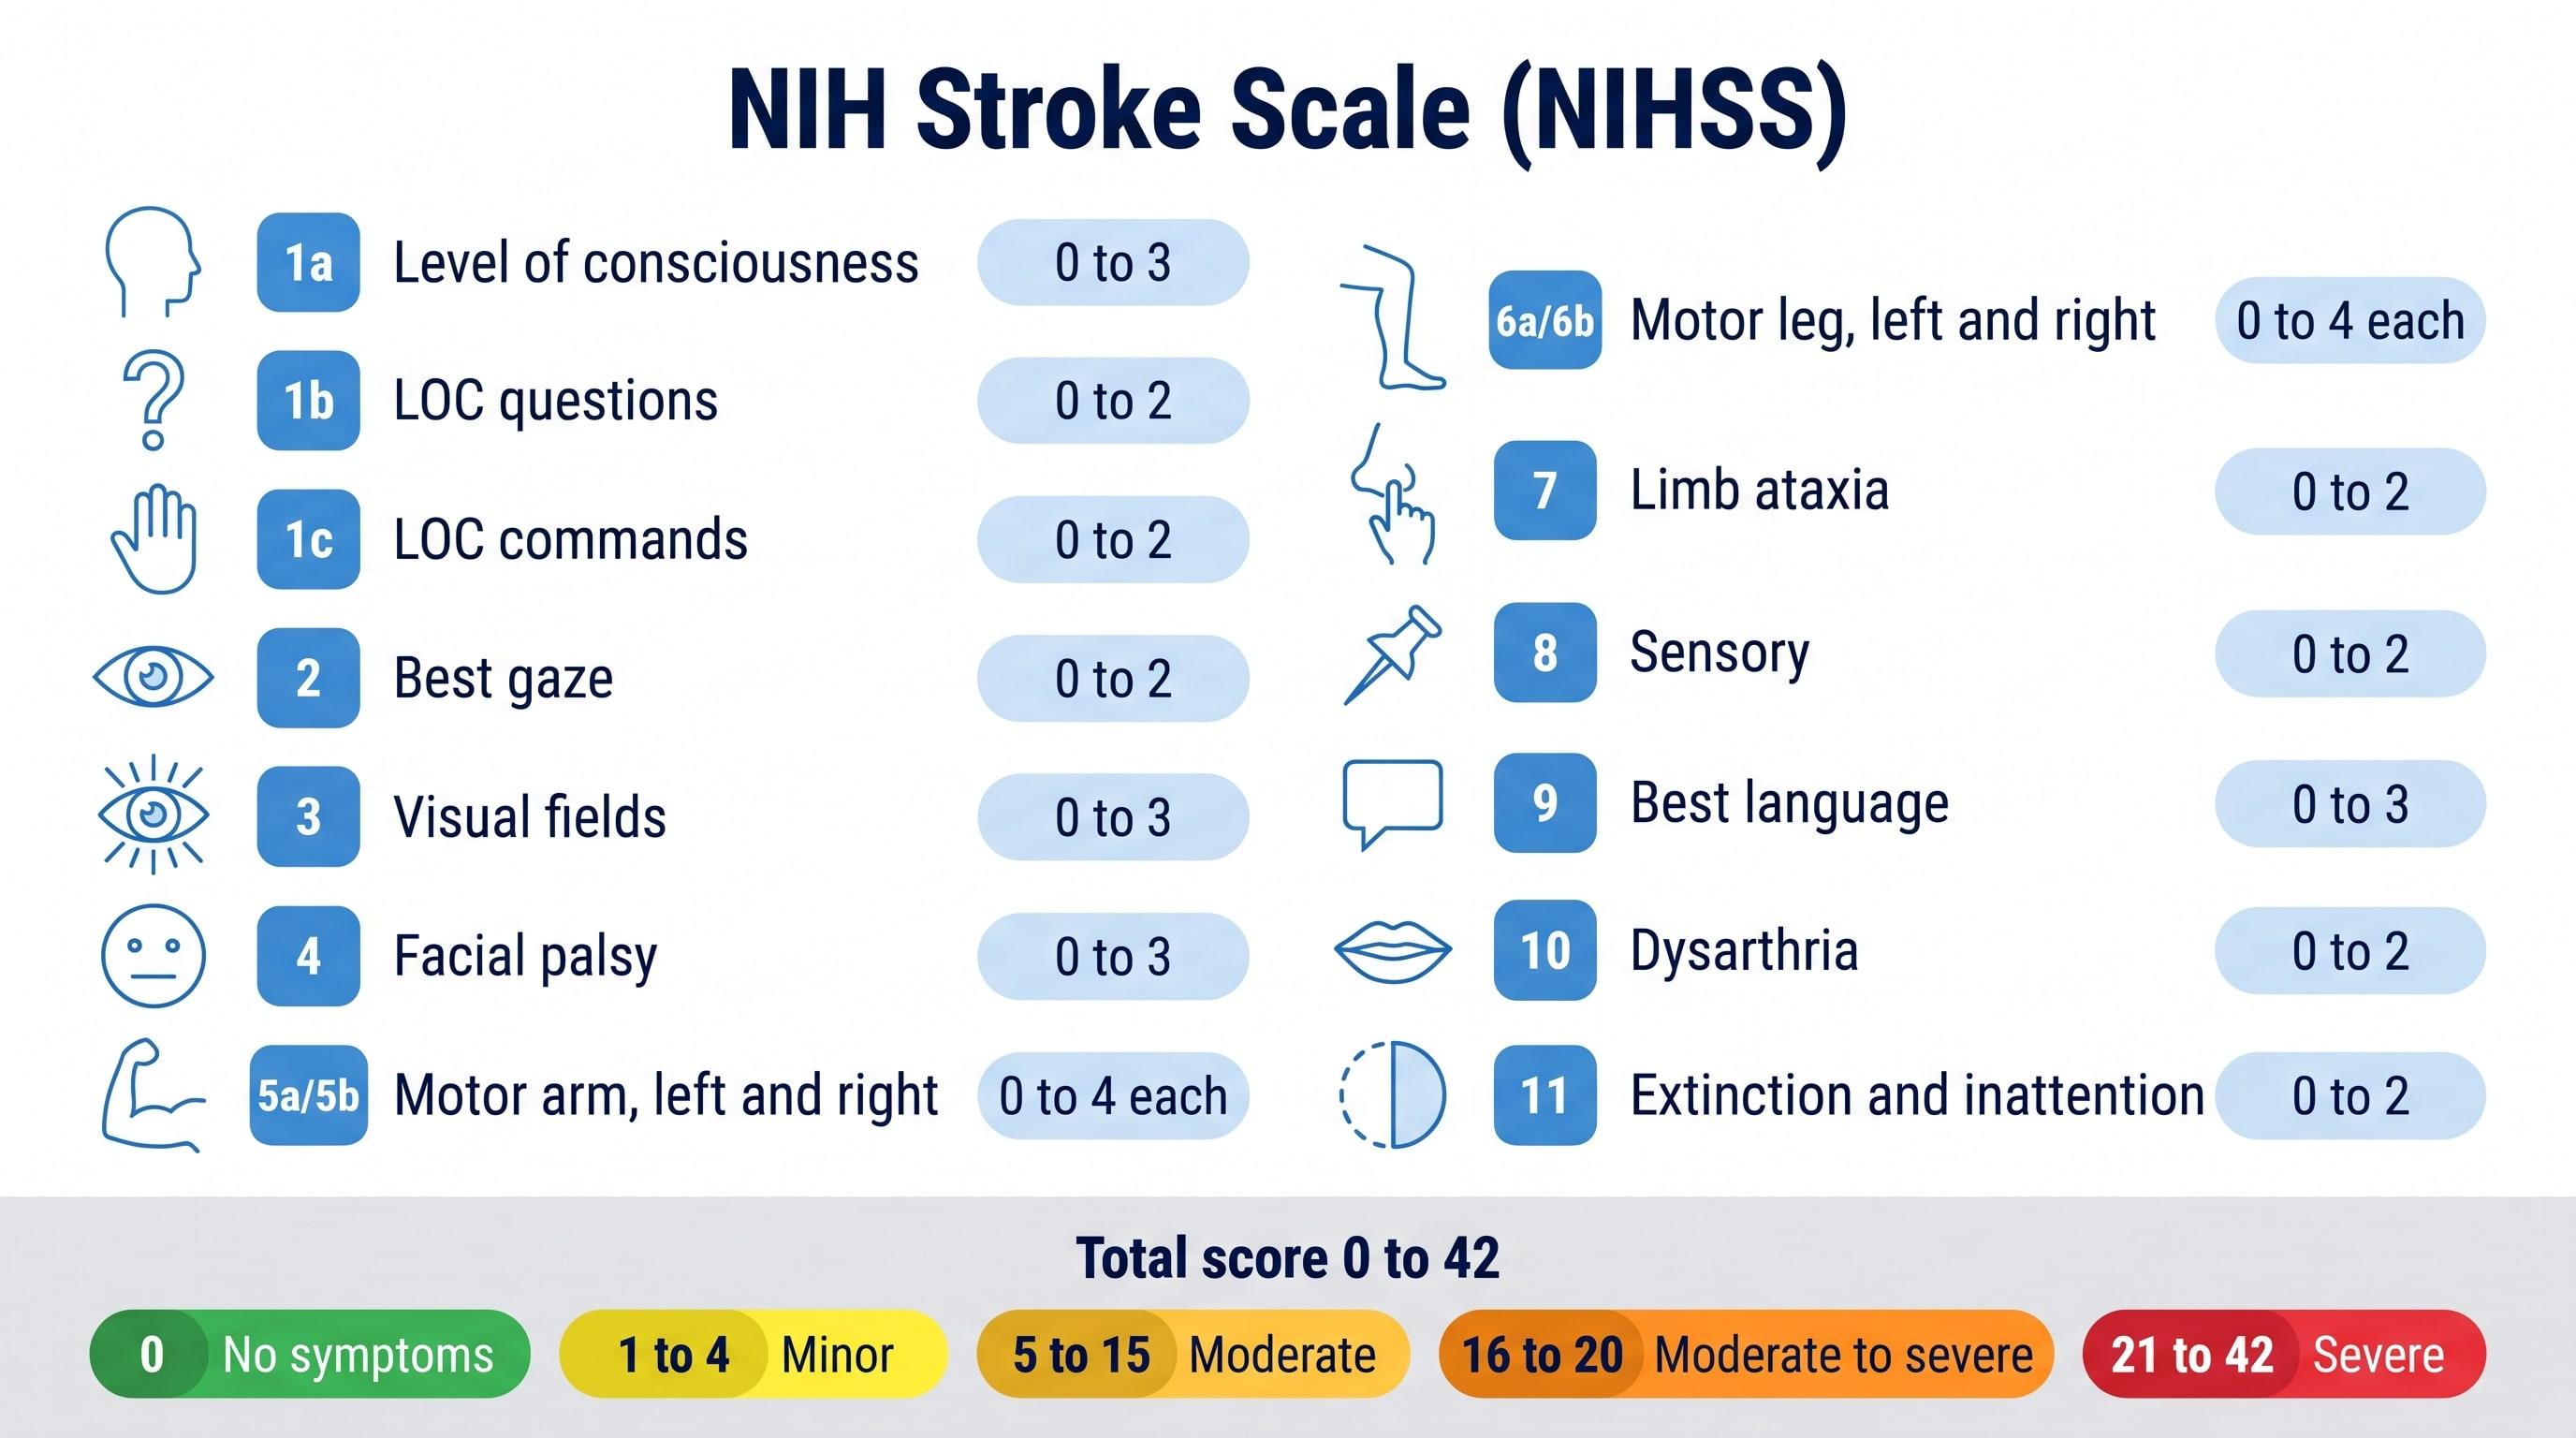
NIHSS Calculator (NIH Stroke Scale)
Score all 15 NIH Stroke Scale items to get the NIHSS total from 0 to 42 and the stroke severity range.
Try it free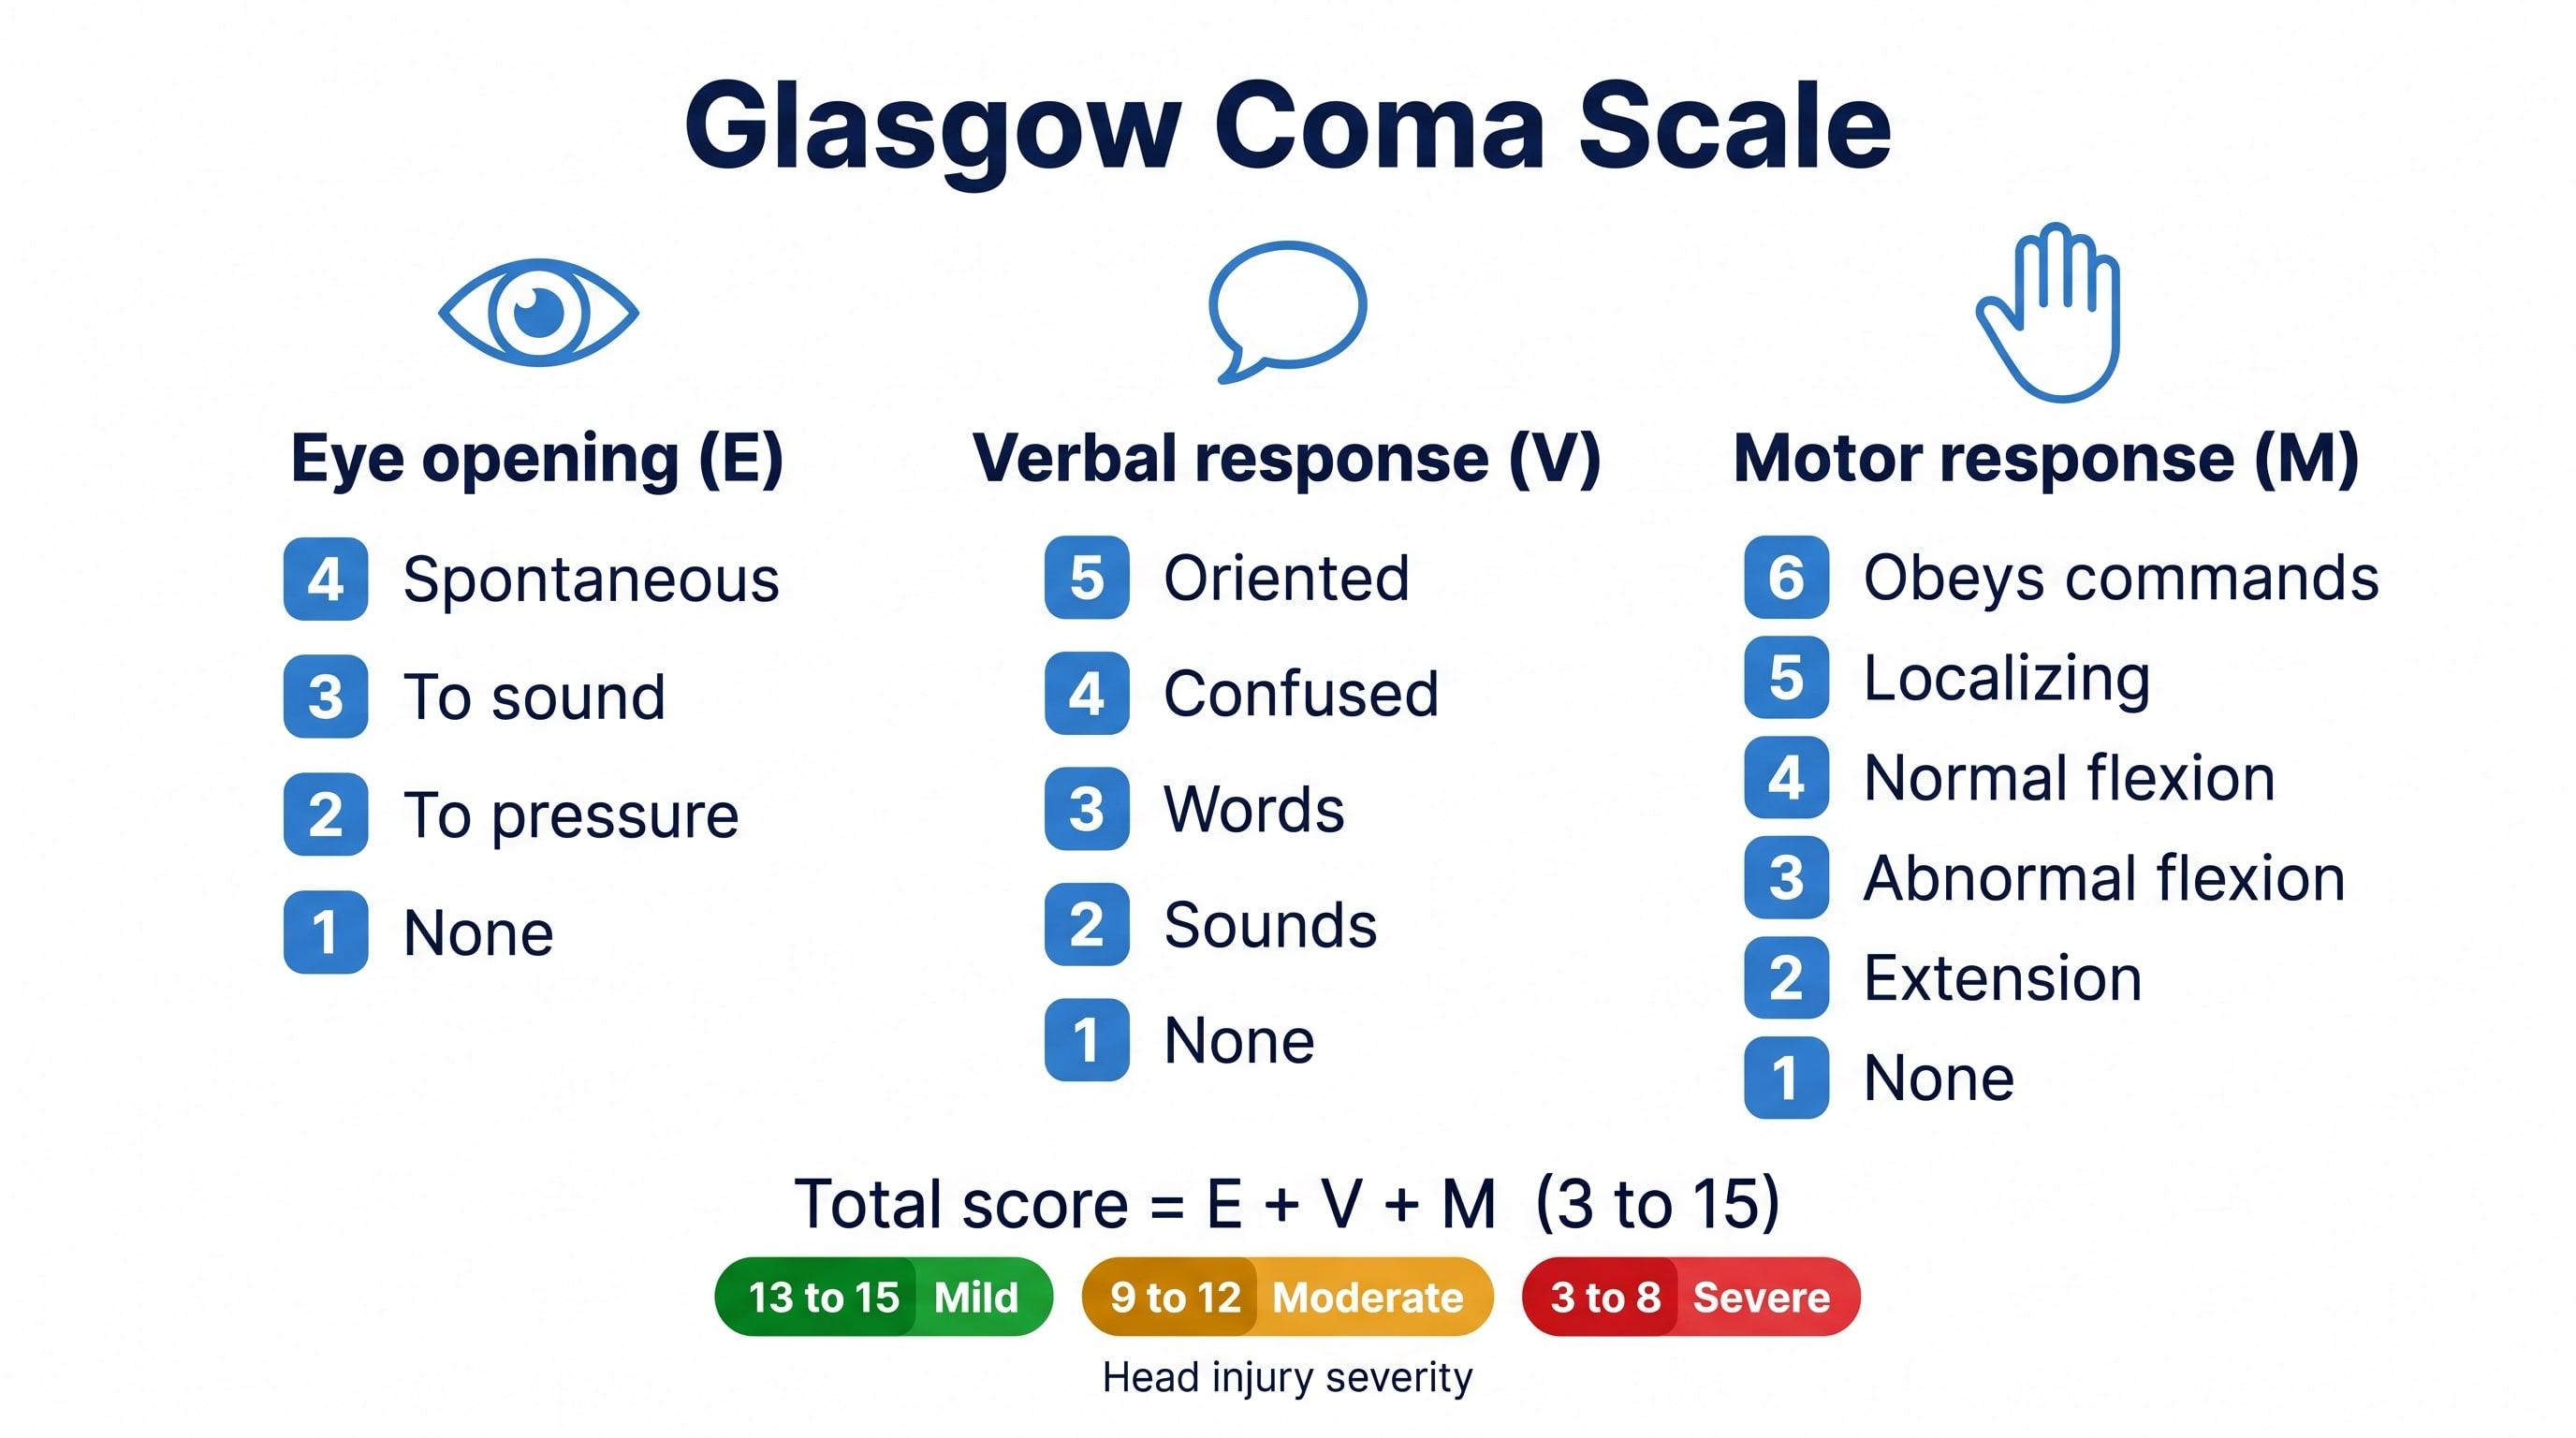
Glasgow Coma Scale Calculator
Score eye, verbal, and motor responses to get the GCS total, E V M code, severity range, and GCS-P.
Try it free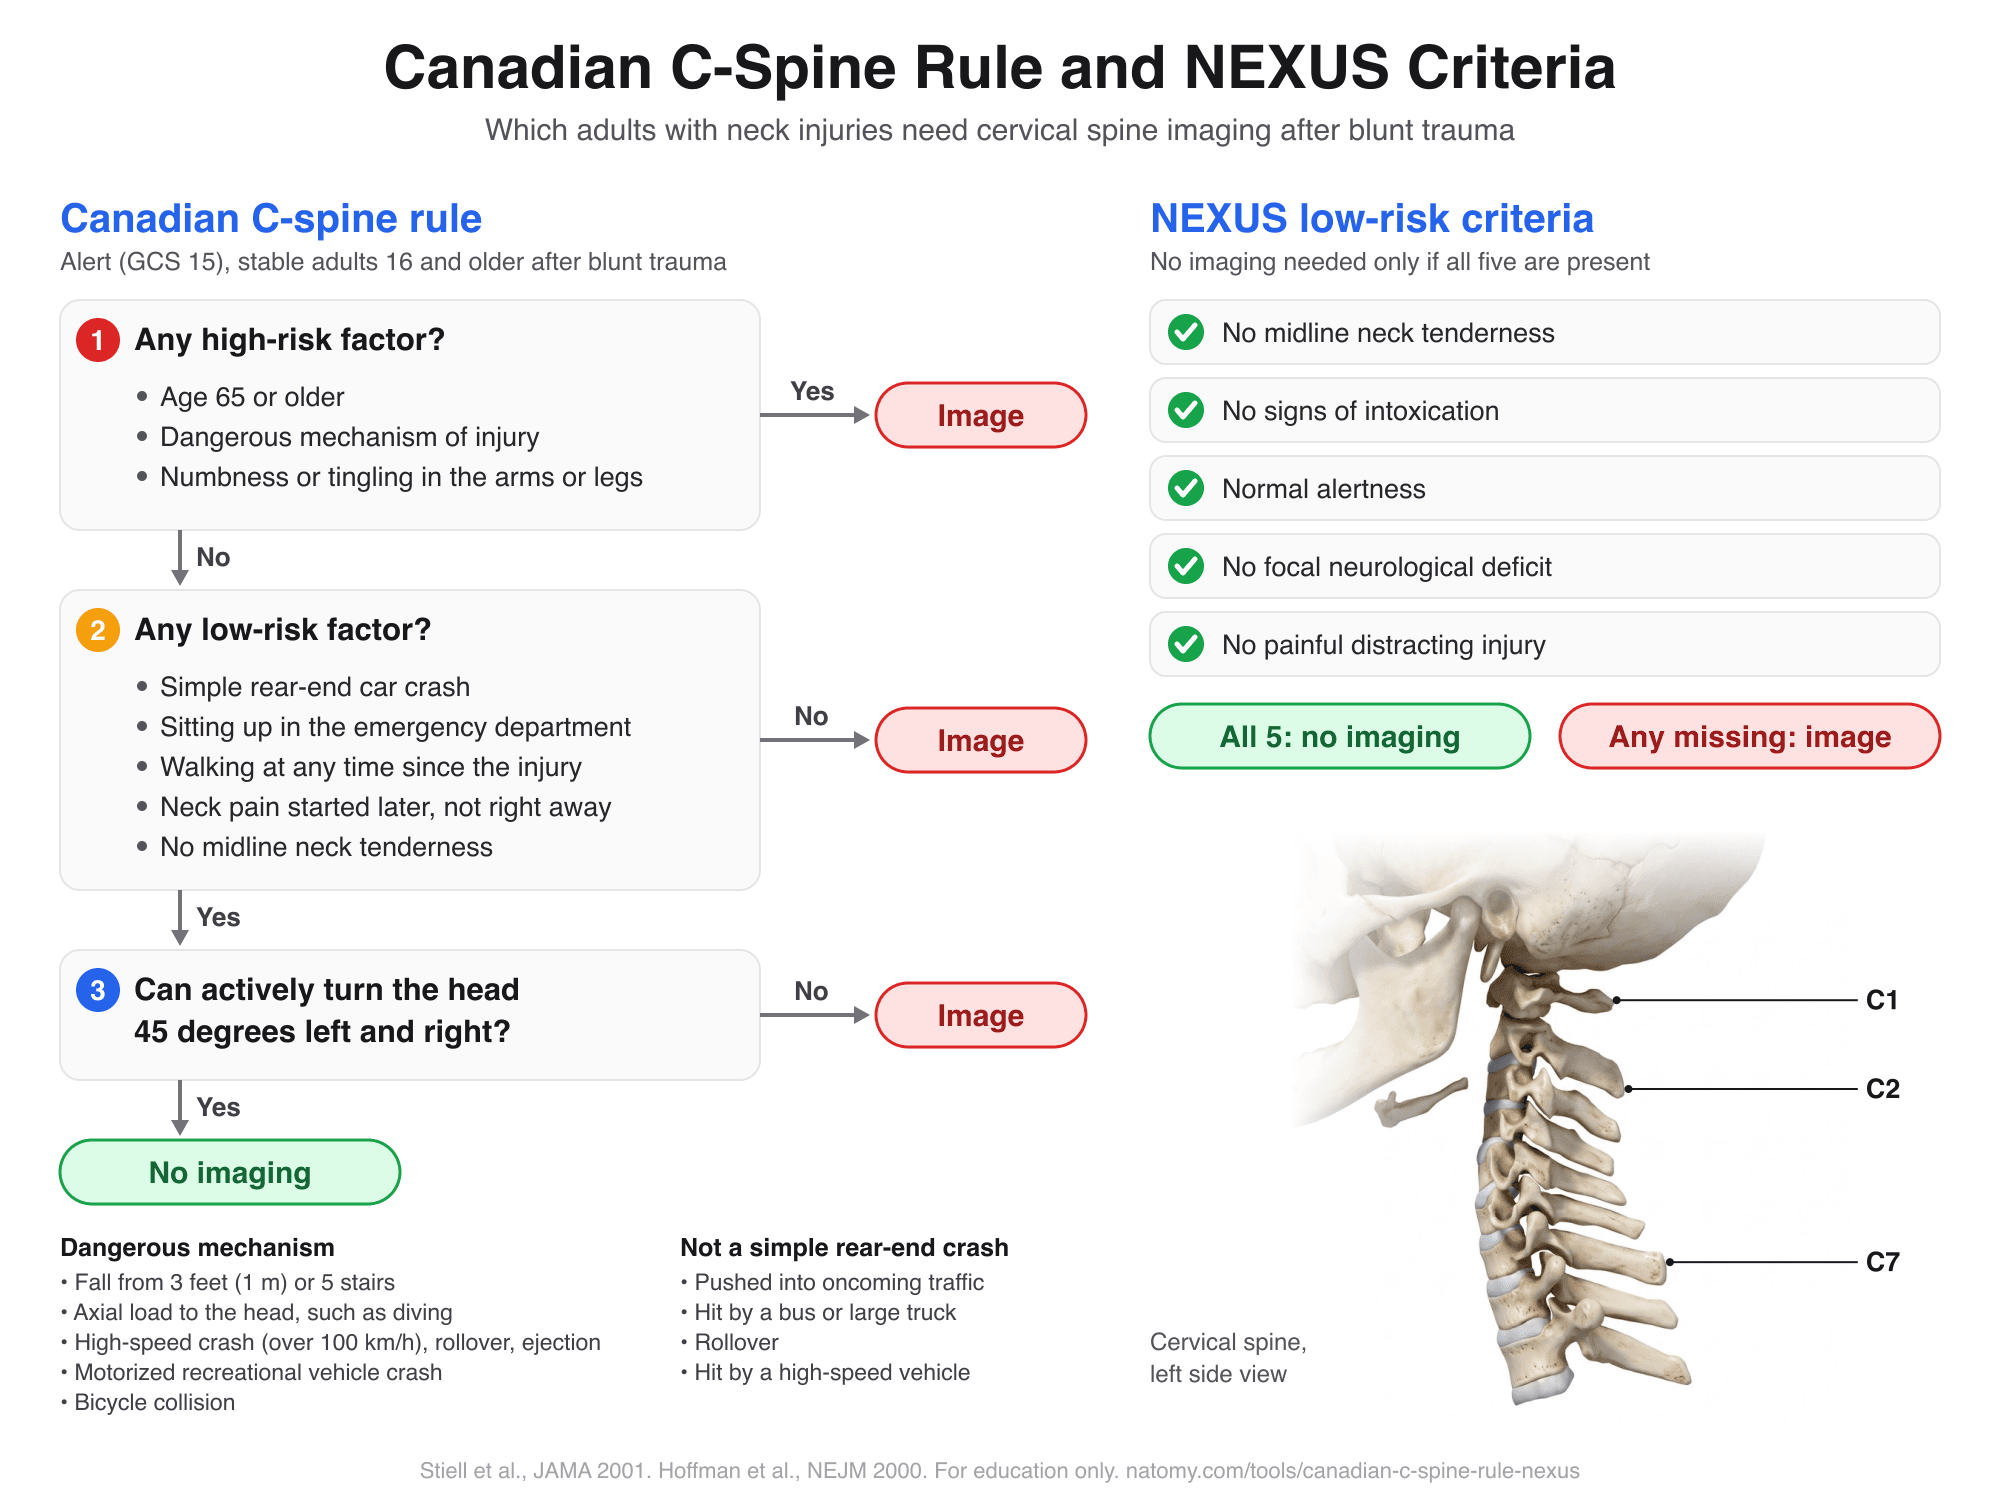
Canadian C-Spine Rule and NEXUS
Run the Canadian C-spine rule or the NEXUS criteria step by step to see which adults need neck imaging after trauma.
Try it free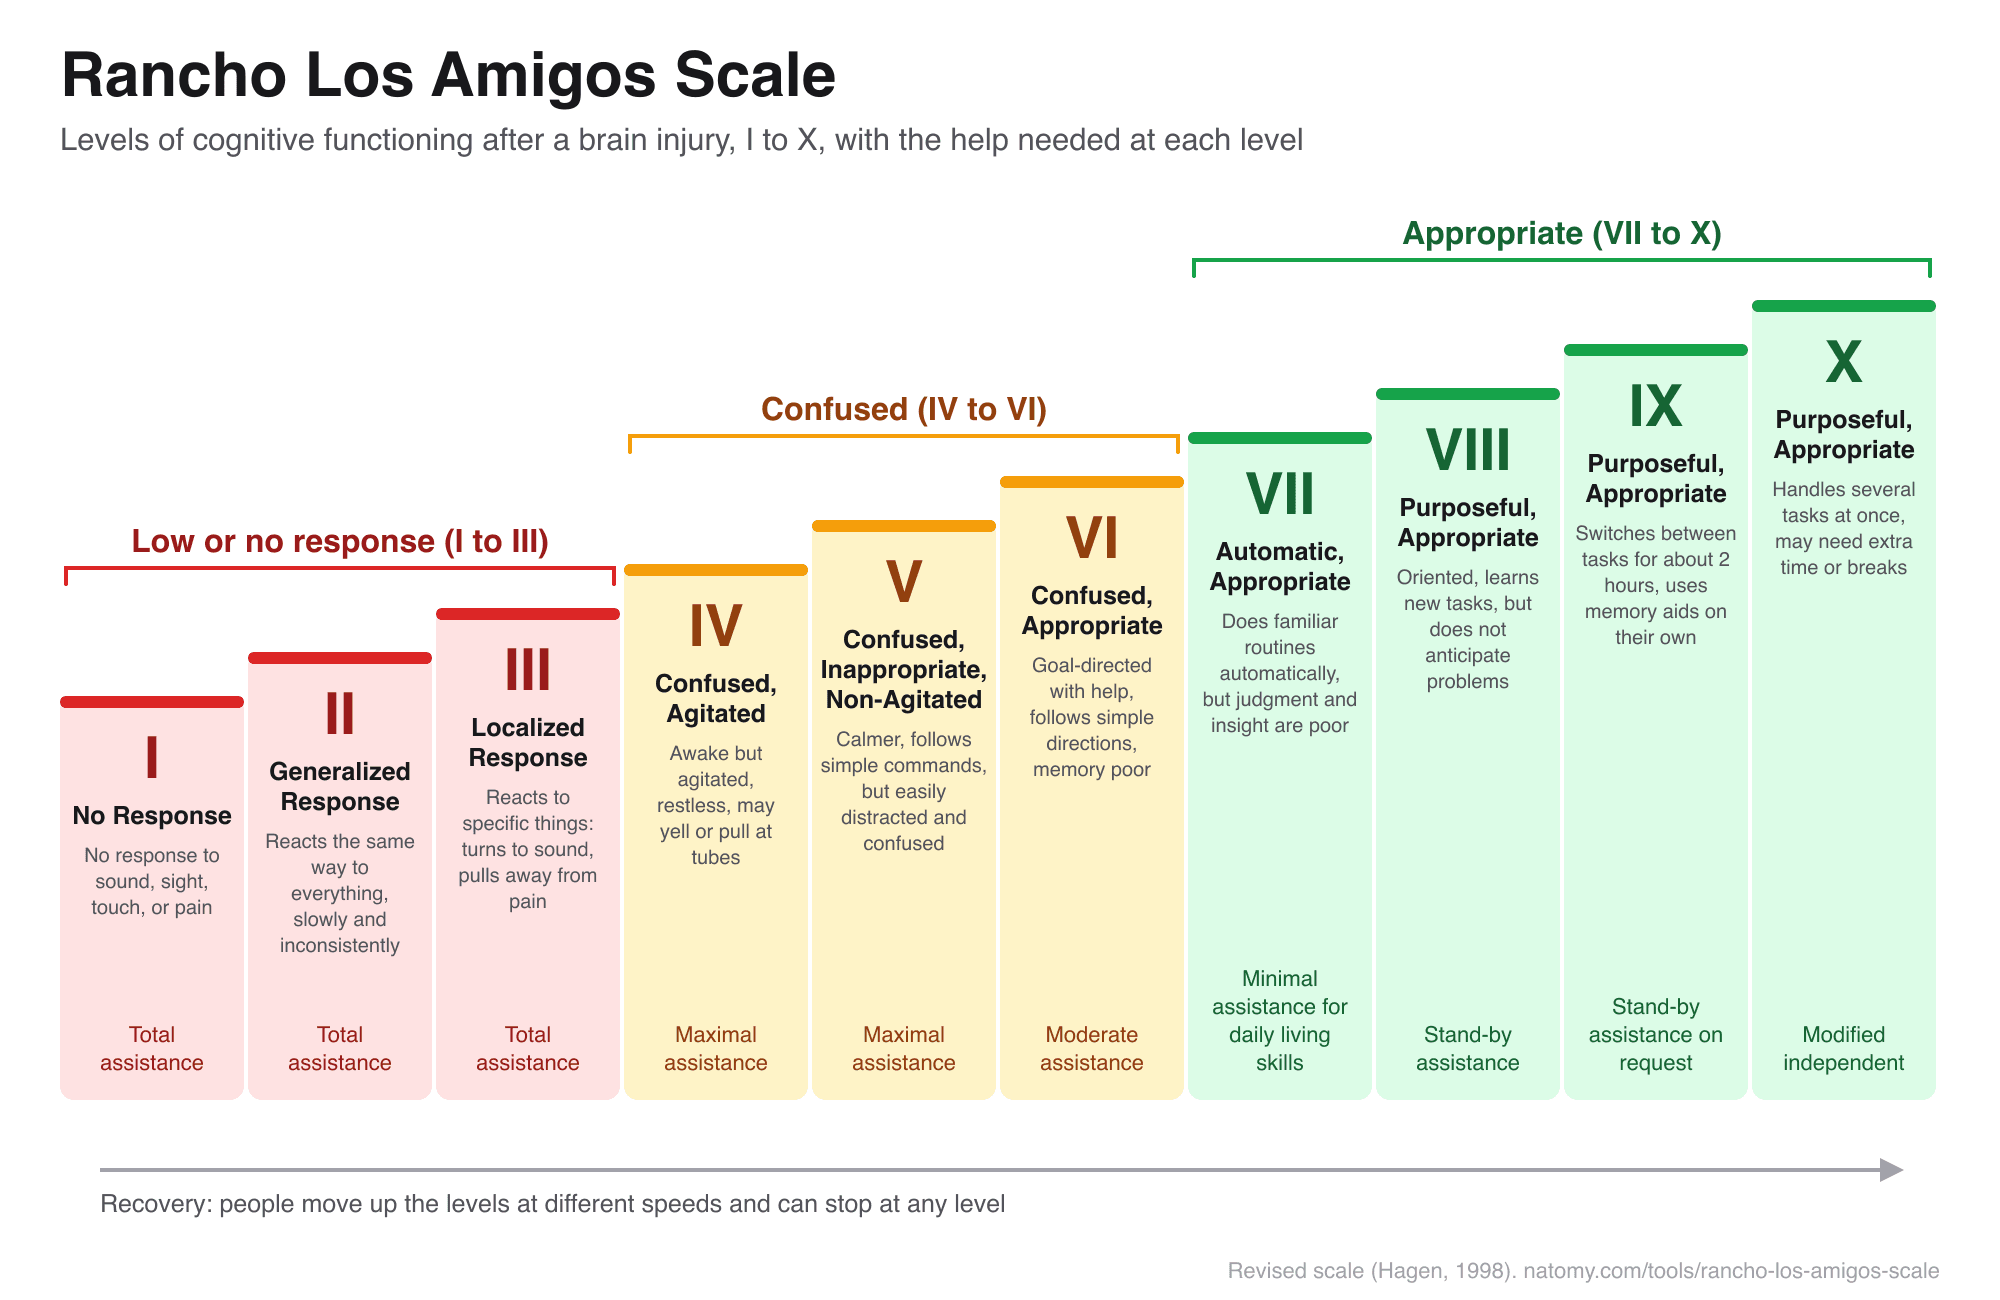
Rancho Los Amigos Scale
The 10 levels of cognitive functioning after a brain injury, with a level finder, what to expect, and how to help.
Try it free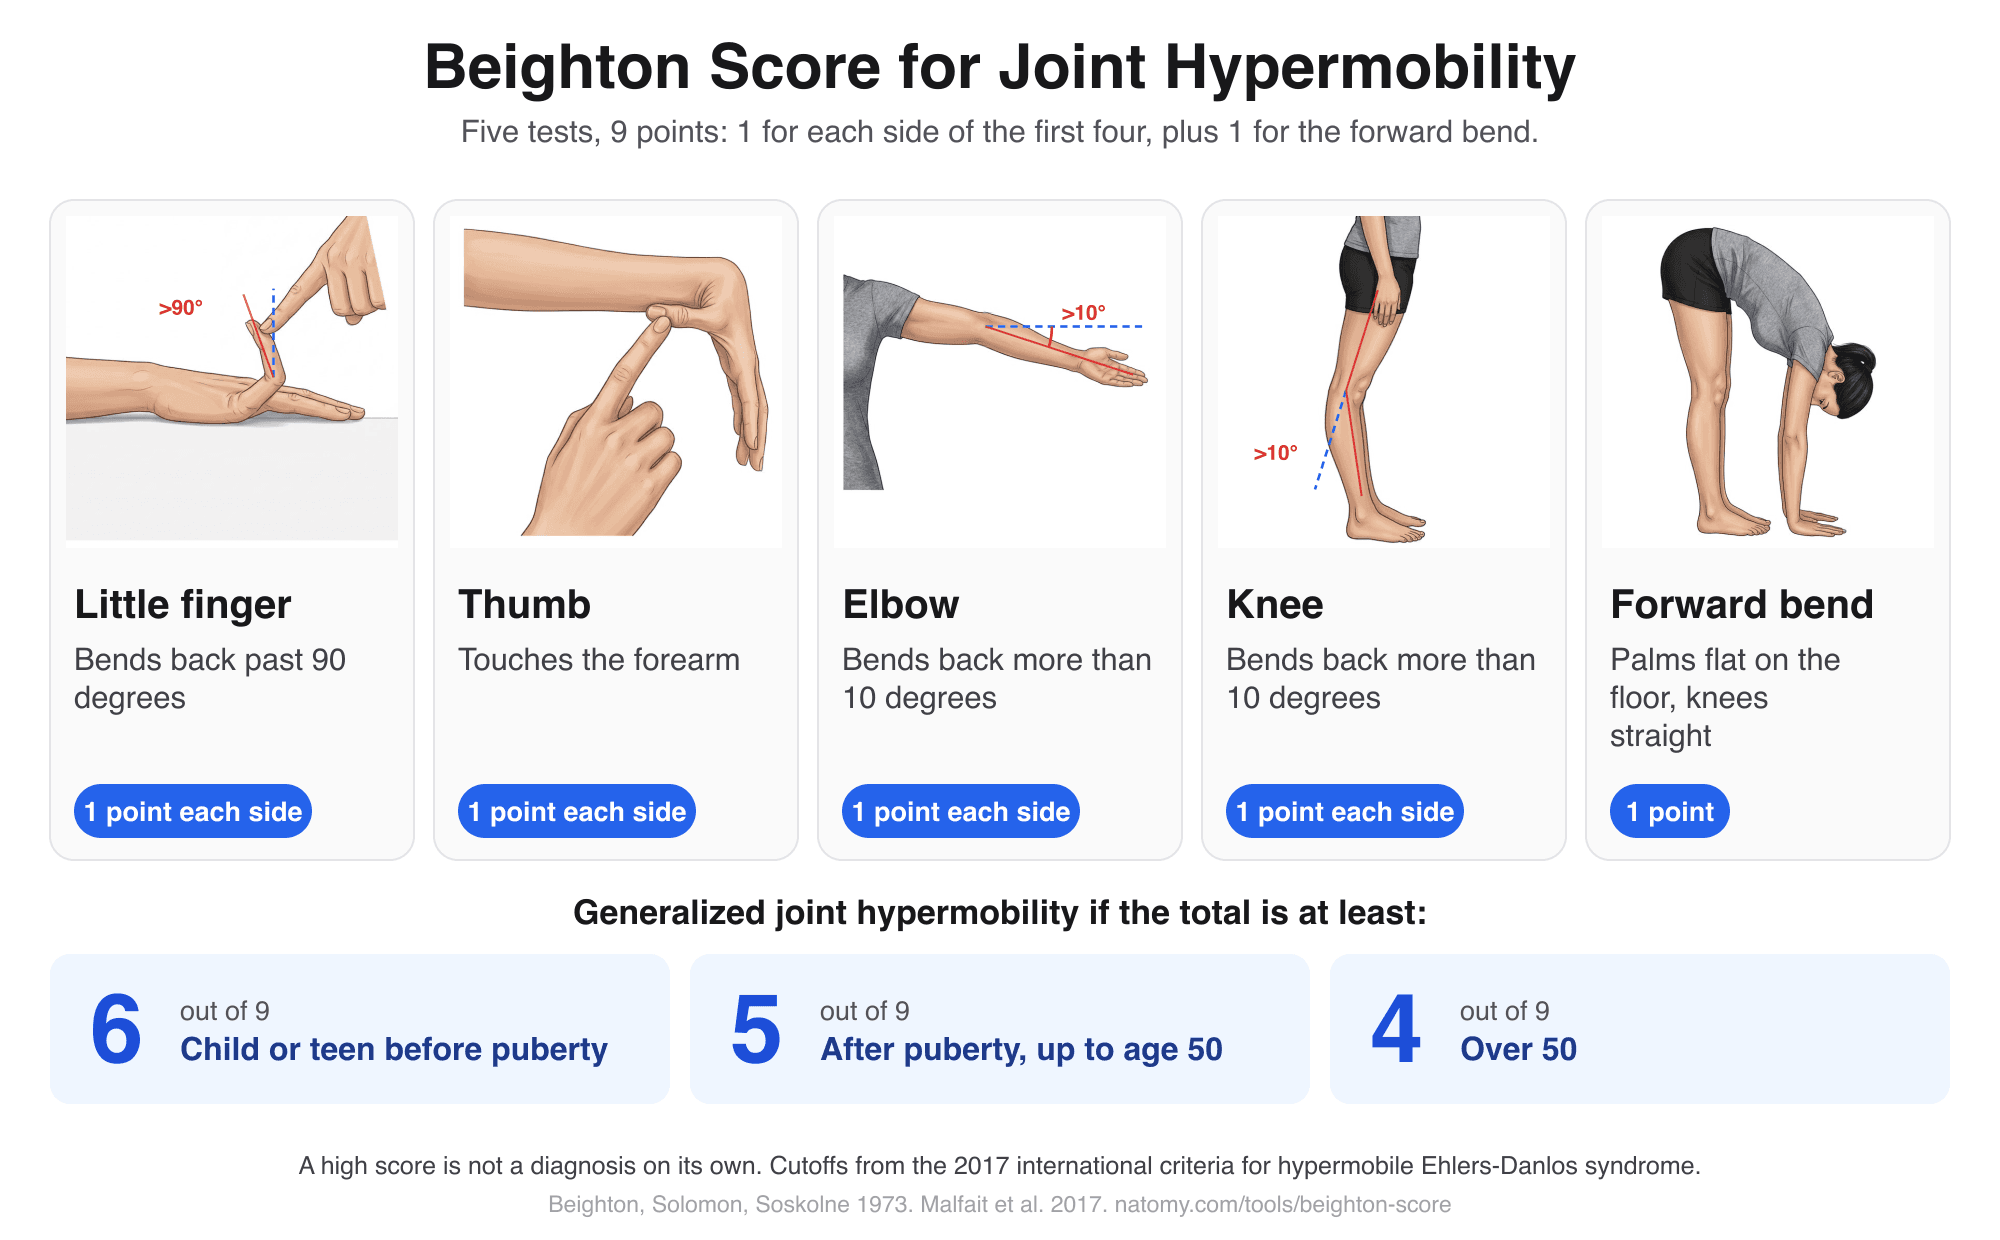
Beighton Score Calculator
Illustrated hypermobility test: score the 5 Beighton movements out of 9, compare with the age cutoff, and copy a note.
Try it free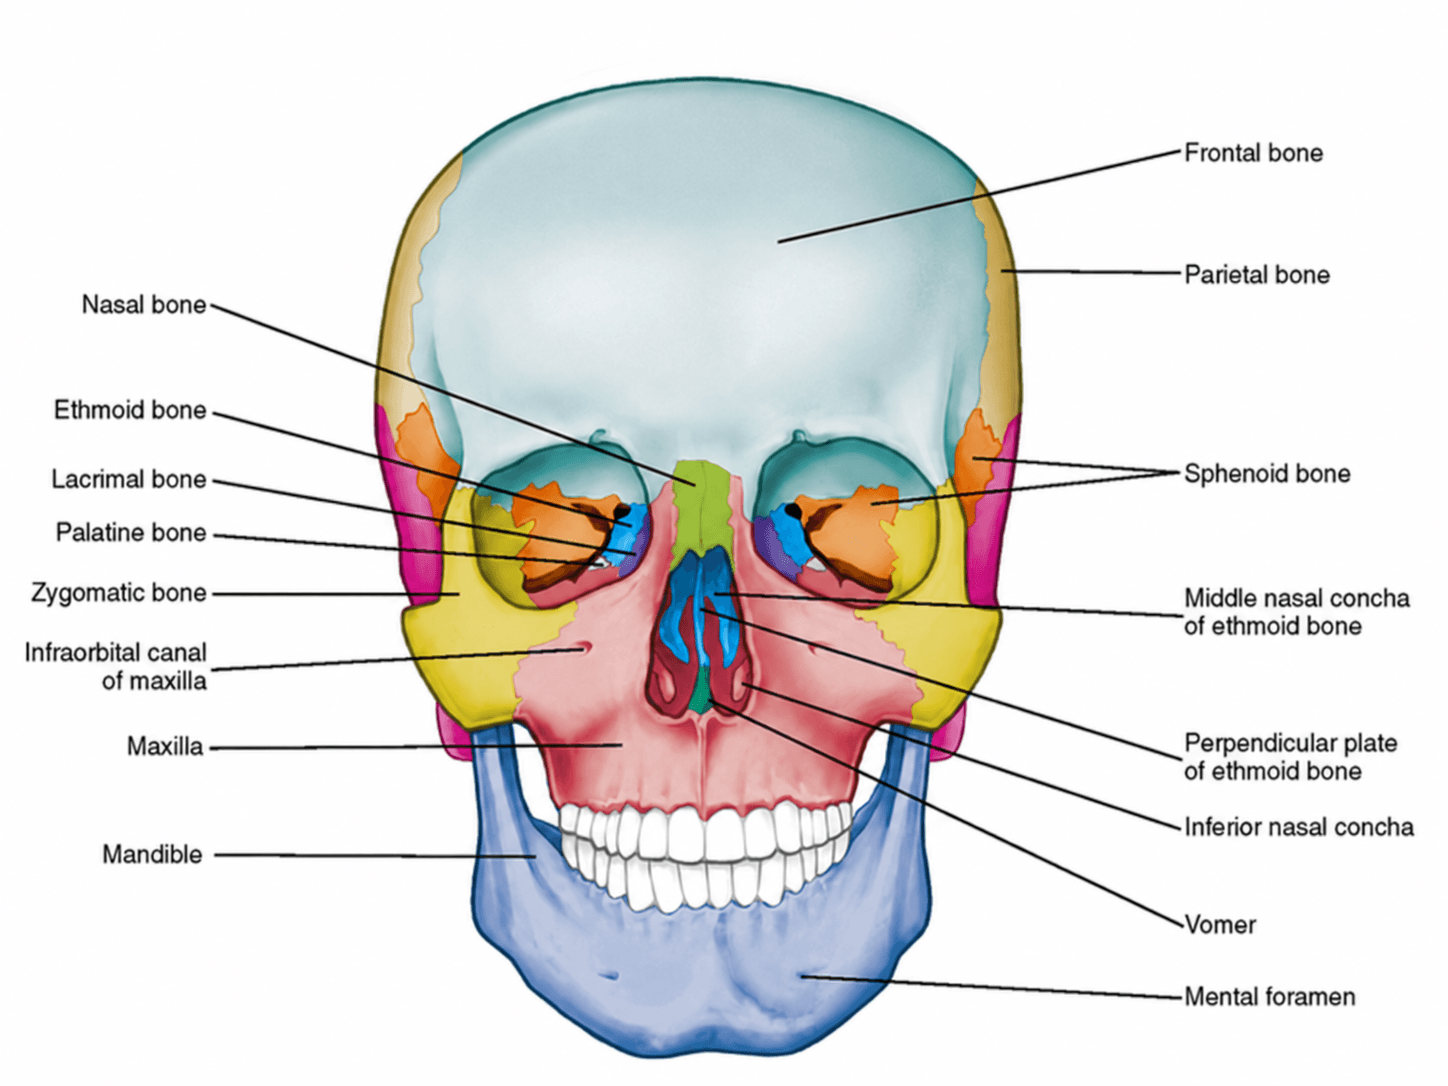
Anterior View of Skull Labeled
Free labeled and unlabeled anterior view of the skull, downloadable as PNG.
Try it free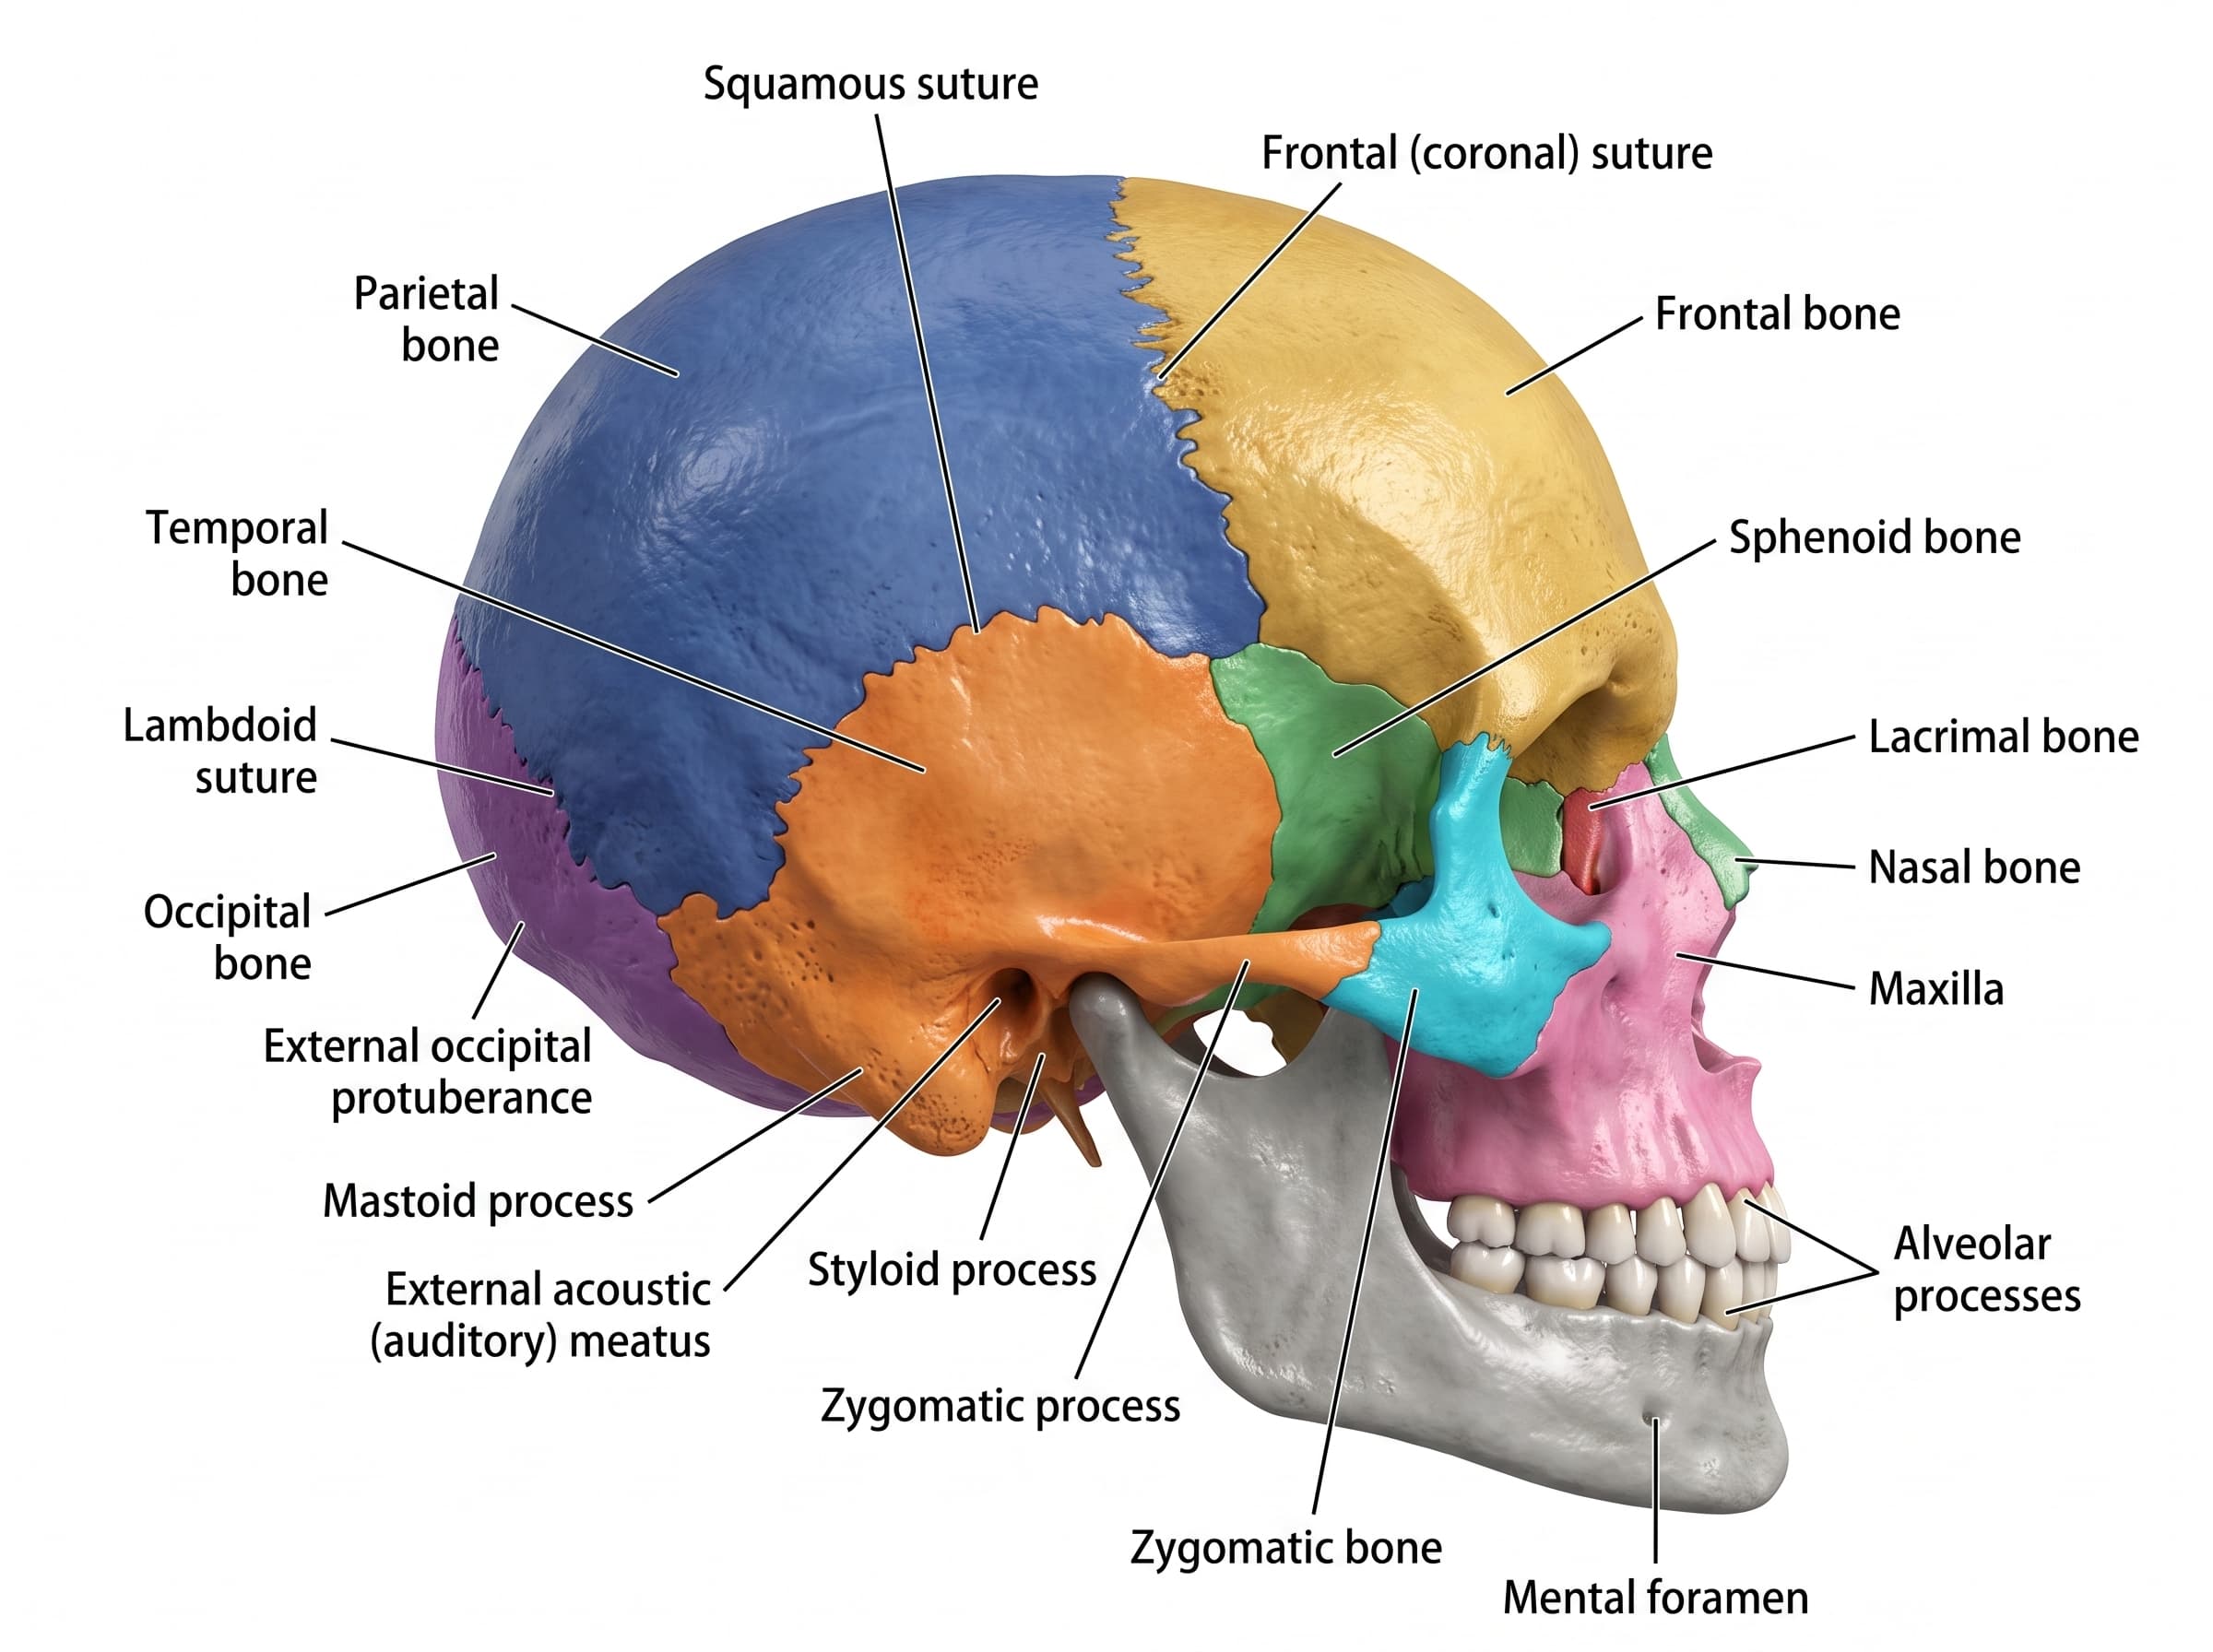
Lateral View of Skull Labeled
Free labeled and unlabeled lateral view of the skull, downloadable as PNG.
Try it free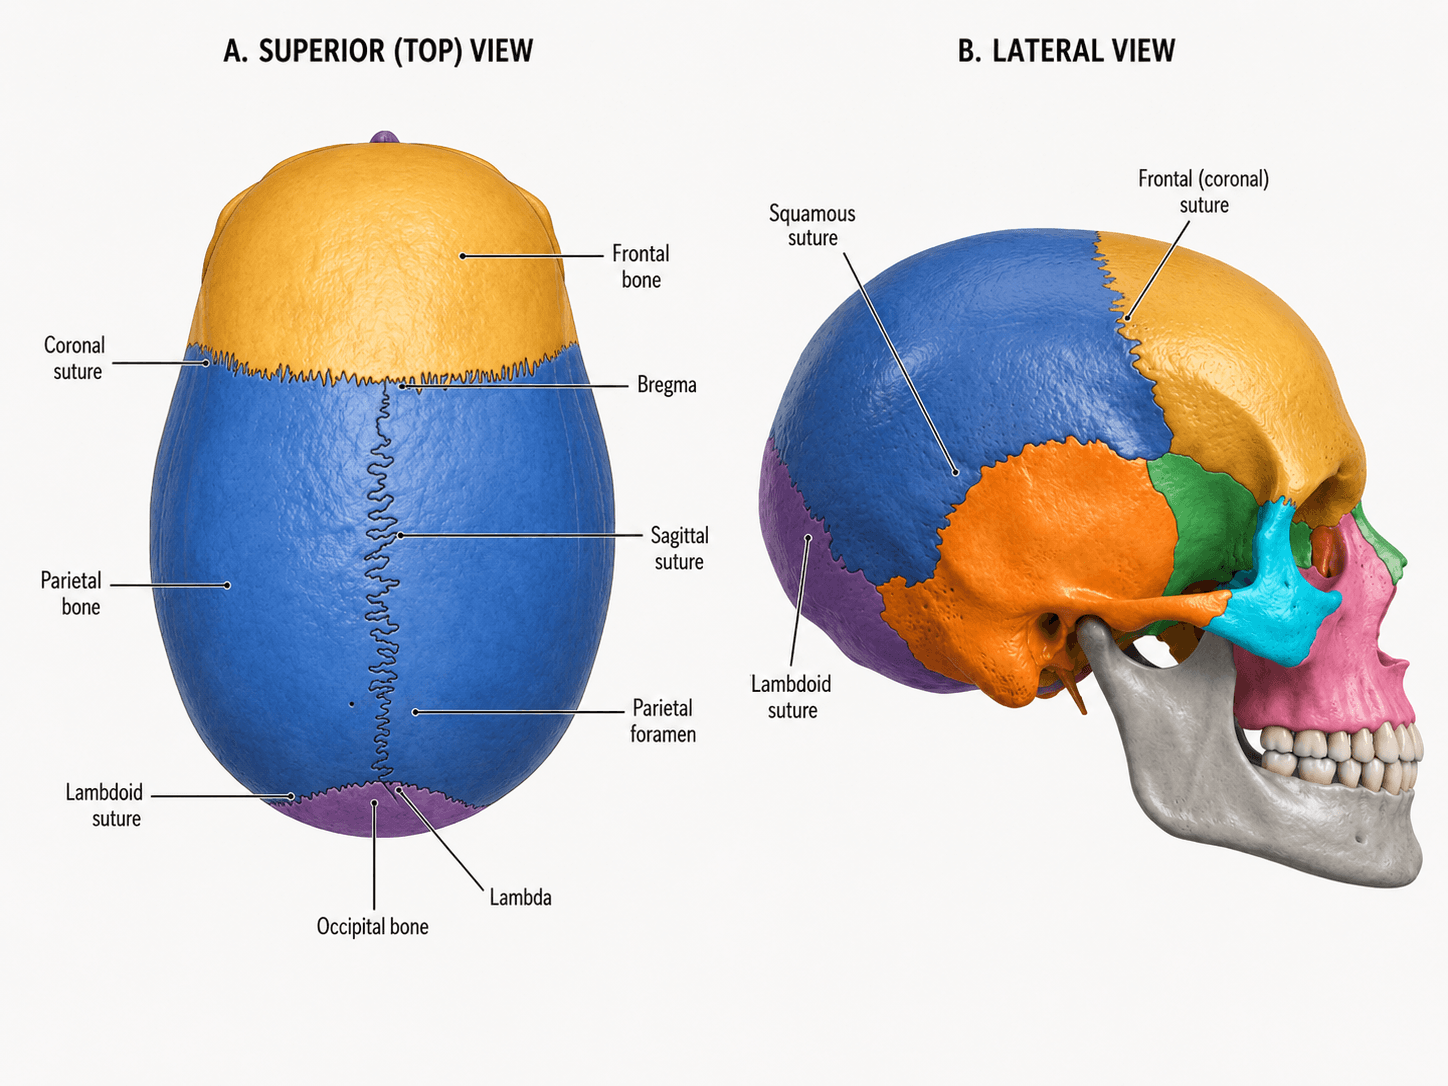
Skull Sutures Labeled
Free labeled and unlabeled skull sutures diagram, superior and lateral views, downloadable as PNG.
Try it free